22 June 2020 : Clinical Research
Predictive Nomogram for Midterm to Long-Term Prognosis in Patients with Papillary Renal Cell Carcinoma Based on Data from the Surveillance, Epidemiology, and End Results (SEER) Program
Haosheng Wang1BCDF, Xueliang Chen1G, Jianwu Zhao1F, Mingyang Kang1BF, Rongpeng Dong1BC, Kai Wang1B, Yang Qu1AEFG*DOI: 10.12659/MSM.921859
Med Sci Monit 2020; 26:e921859


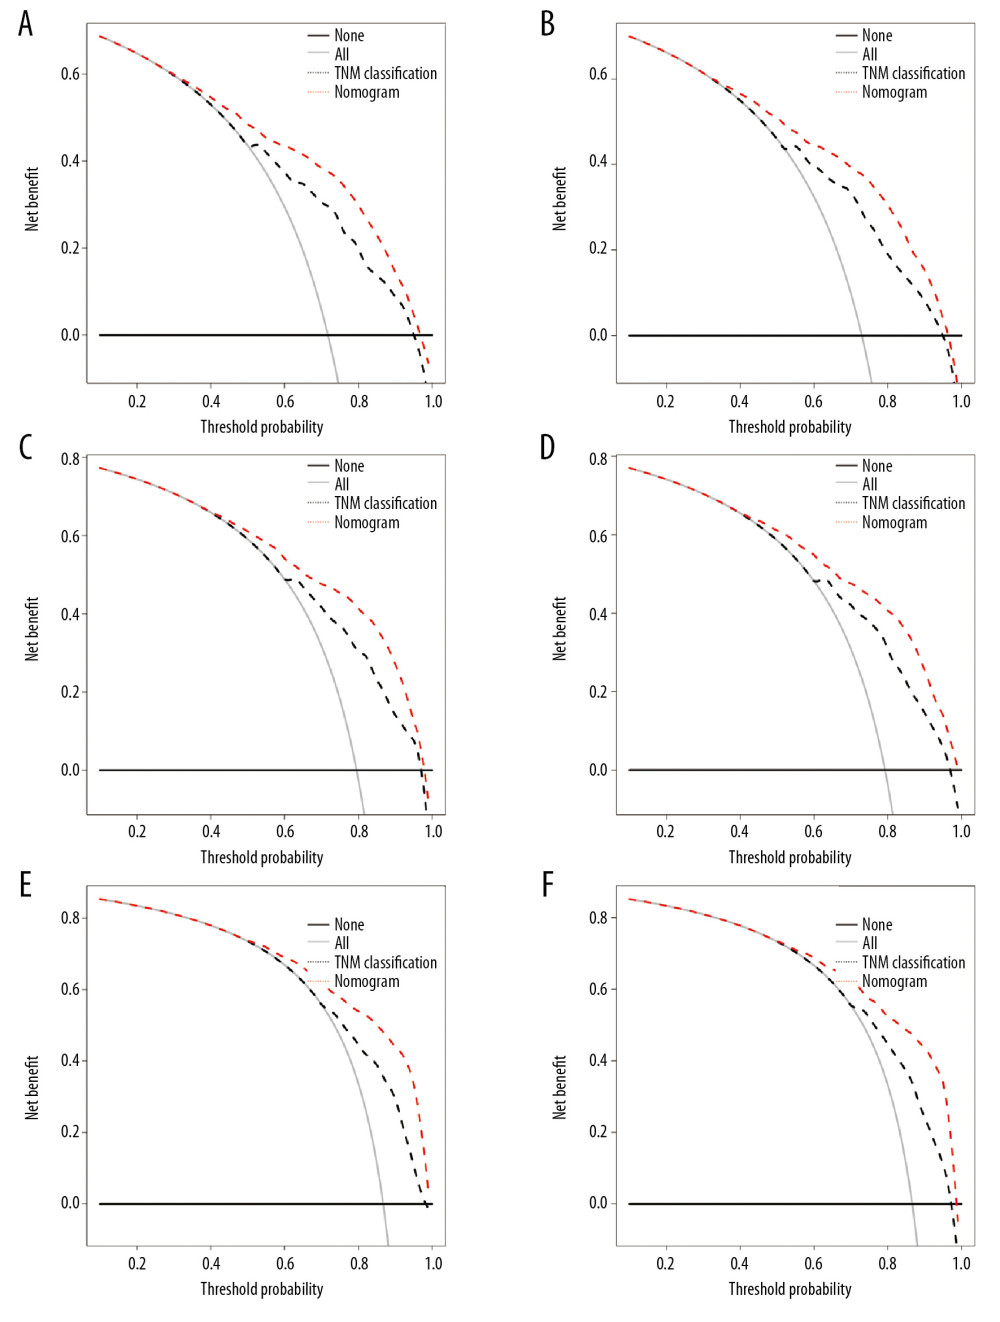
Figure 6 The decision curve analysis (DCA) for the training cohort (A, C, E) and validation cohort (B, D, F) for the 3-year, 5-year, and 10-year overall survival (OS). In the figure, the red dotted line represents the new nomogram model. The black dotted line represents the TNM classification. All – assume all patients with papillary RCC survive; None – assume no patient with papillary RCC survived; DCA – decision curve analysis.