18 June 2020 : Database Analysis
Using the TCGA Database to Predict and Analyze Tumor Microenvironment Genes Related to Poor Prognosis of Colon Cancer
Sihan Chen1A*, Lu Yida1C, Bo Chen1G, MaoMing Xiong1GDOI: 10.12659/MSM.923707
Med Sci Monit 2020; 26:e923707


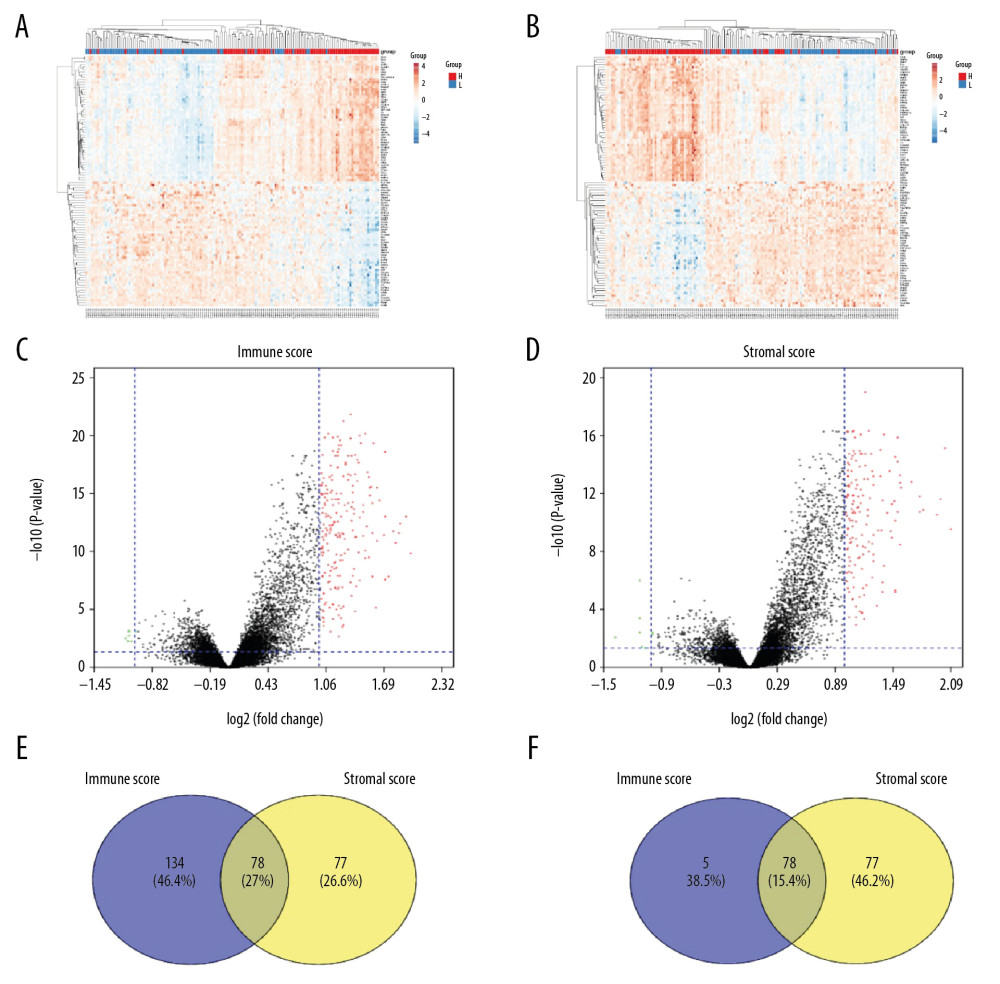
Figure 2 Comparison of COAD gene expression profile with immune score and stromal score. (A) Heat map of the immune score genes for the red part (high score group) and the blue part (low score group). (B) Heat map of the stromal score genes for the red part (high score group) and the blue part (low score group). (C) The volcano plot results show that the red dots are high expression data with an immune score of logFC ≥1.0, p<0.05; the green dots show low expression data with an immune score of logFC ≤1.0, p<0.05. (D) The volcano plot results show that the red dots are high expression data with a stromal score of logFC ≥1.0 and p<0.05; the green dots show low expression data with a stromal score of logFC ≤1.0 and p<0.05. The Venn diagram shows the number of genes that are usually upregulated (E) or downregulated (F) in the stromal and immune score groups.