14 October 2020 : Database Analysis
A Mechanism Underlying Sex-Associated Differences in Ankylosing Spondylitis: Troponin C2, Fast Skeletal Type (TNNC2) and Calcium Signaling Pathway
Chaojie Yu1ABCDEF, Xinli Zhan2AG*, Chong Liu2AG, Zide Zhang1BC, Jie Jiang1DE, Guoyong Xu1DF, Jiang Xue1BDDOI: 10.12659/MSM.925179
Med Sci Monit 2020; 26:e925179


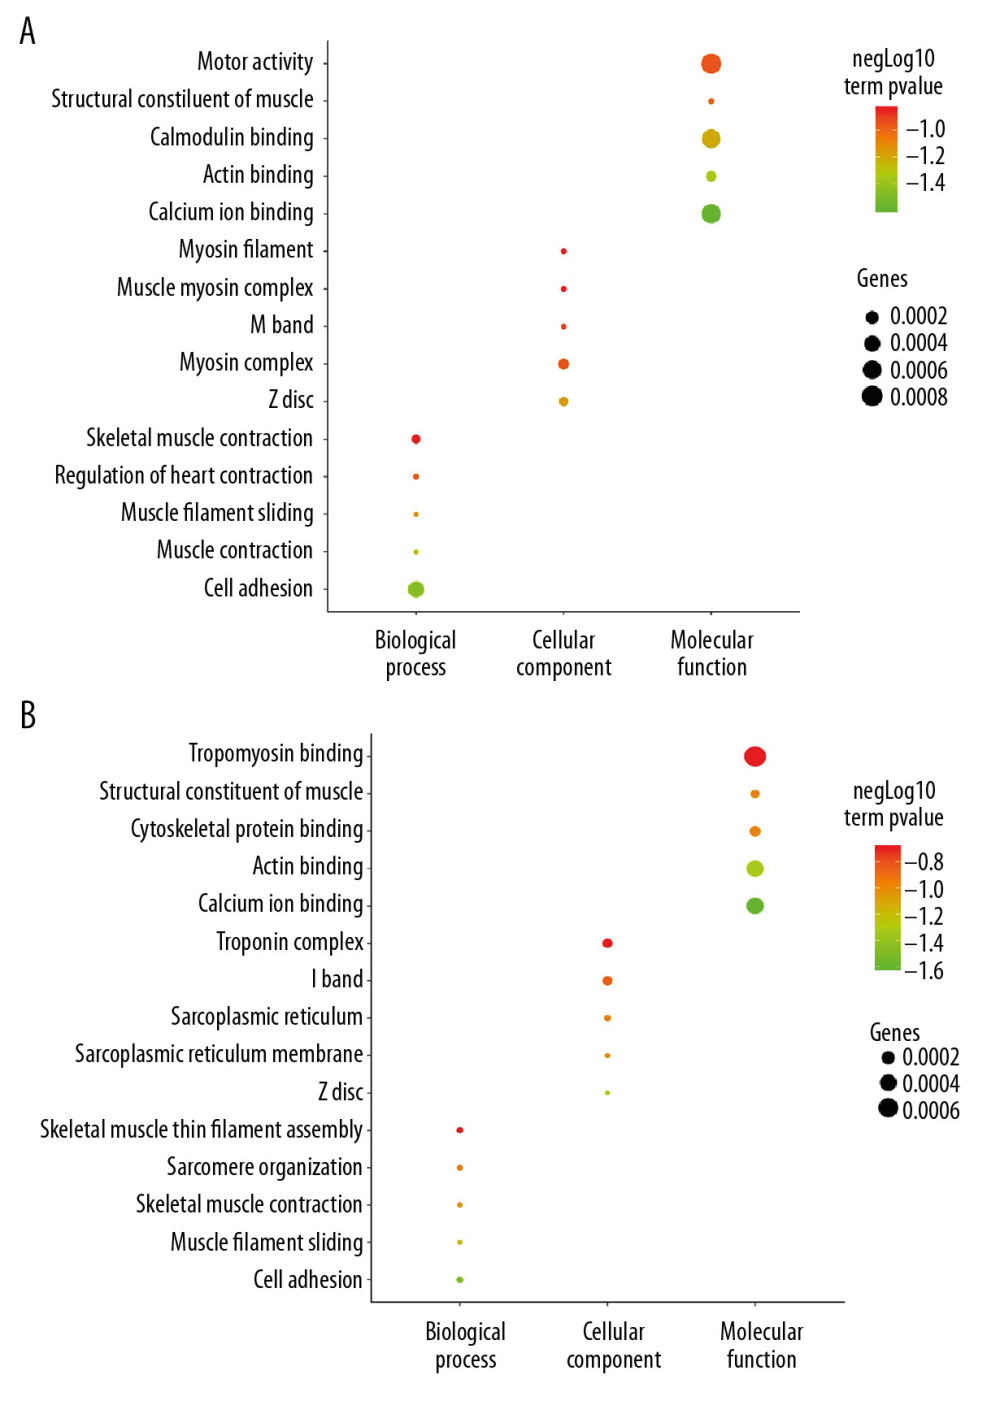
Figure 3 GO enrichment analysis of DEGs between AS and No-AS groups. The function of DEGs in tissues is described according to its GO characteristics (biological process, molecular function, cell components). The top 5 items for each category are shown in the figure. The color of the dot represents the -log10 (p-value) of the item. The size of the dot represents the number of genes with the given GO annotation. (A) AS and No-AS groups, (B) M-AS and F-AS groups.