17 November 2020 : Clinical Research
Correlation Between Quantitative Assessment of Chest Computed Tomography (CT) Imaging and Prognosis of COVID-19 Patients
Rongrong Liu1ABCDE, Guangqiang Chen2ACEF, Yi Zhu1BCDE, Jing Liu1ABDE, Wei Tang3BD, Jianbing Zhu4ACDE*, Min Li1ABCDEDOI: 10.12659/MSM.925183
Med Sci Monit 2020; 26:e925183


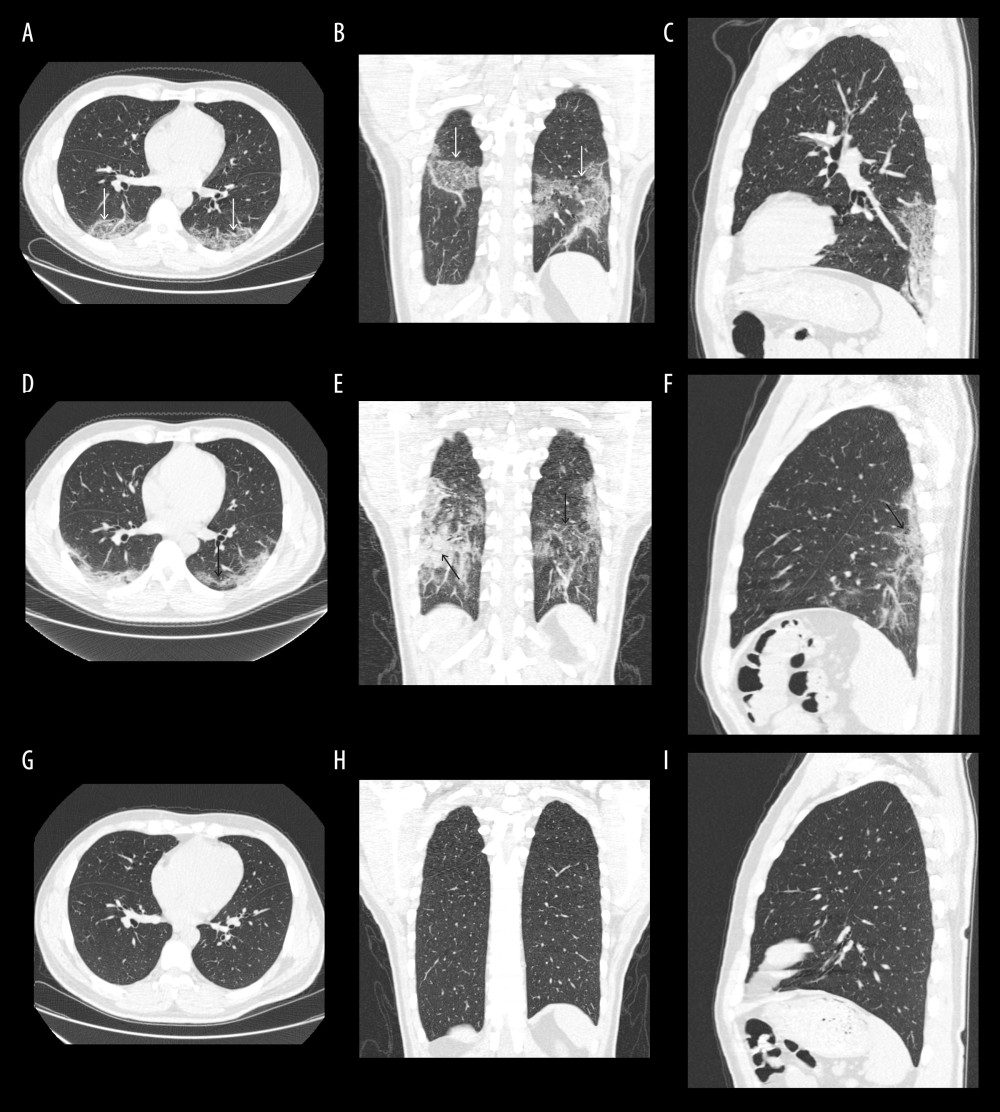
Figure 2 (A–I) A 39-year-old man with COVID-19. A–C=day 7, D–F=day 10, G–I=day 33, PIT25=3 days. (A–C) In the peak CT, chest images obtained on day 7 from symptoms onset. Chest axial image A, coronal reconstruction image B, and sagittal construction C show mixed lesions of GGO and reticulation in bilateral lower lobes, which are distributed in subpleural area (white arrow). (D–F) In the 25% improvement CT, chest images obtained on day 10 from symptoms onset. Chest axial image A, coronal reconstruction image B, and sagittal construction C show the lesions absorbed in the lower lobe, mainly in the left lung (short black arrow), and some of them transformed into consolidations (long black arrow). (G–I) In the last CT, chest images obtained on day 33 from symptoms onset. Chest images show the lesions in bilateral lung absorbed well.