17 November 2020 : Clinical Research
Correlation Between Quantitative Assessment of Chest Computed Tomography (CT) Imaging and Prognosis of COVID-19 Patients
Rongrong Liu1ABCDE, Guangqiang Chen2ACEF, Yi Zhu1BCDE, Jing Liu1ABDE, Wei Tang3BD, Jianbing Zhu4ACDE*, Min Li1ABCDEDOI: 10.12659/MSM.925183
Med Sci Monit 2020; 26:e925183


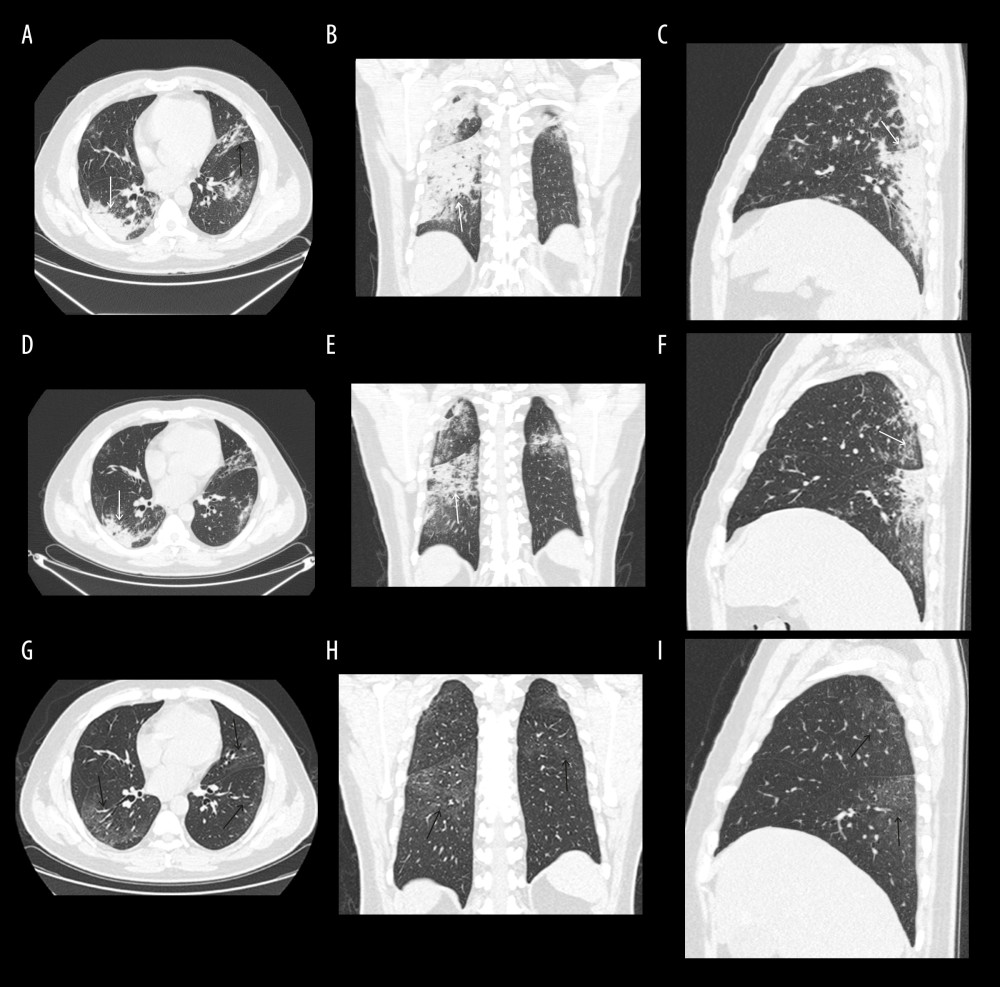
Figure 3 (A–I) A 44-year-old man with COVID-19. A–C=day 15, D–F=day 21, G–I=day 44, PIT25=6 days. (A–C) In the peak CT, chest images obtained on day 15 from symptoms onset. Chest axial image A, coronal reconstruction image B, and sagittal construction C show consolidation (short white arrow) and reticulation (short black arrow) in bilateral multiple lobes, which were distributed in center and subpleural areas, mainly in the subpleural areas. (D–F) In the 25% improvement CT, chest images obtained on day 21 from symptoms onset. Chest axial image A, coronal reconstruction image B, and sagittal construction C show the lesions absorbed in the bilateral lower lobe, mainly in the right lung (long white arrow). (G–I) In the last CT, chest images obtained on day 44 from symptoms onset. Chest images show the lesions in bilateral lung, with unclear absorption, leaving multiple thin GGOs (long black arrow).