23 August 2020 : Database Analysis
Integrated Bioinformatics Analysis Reveals Potential Pathway Biomarkers and Their Interactions for Clubfoot
Jing Ding1BCDEF, Zhenpeng Liang1BCDE, Weijia Feng1EF, Qixun Cai1AG*, Ziming Zhang1AGDOI: 10.12659/MSM.925249
Med Sci Monit 2020; 26:e925249


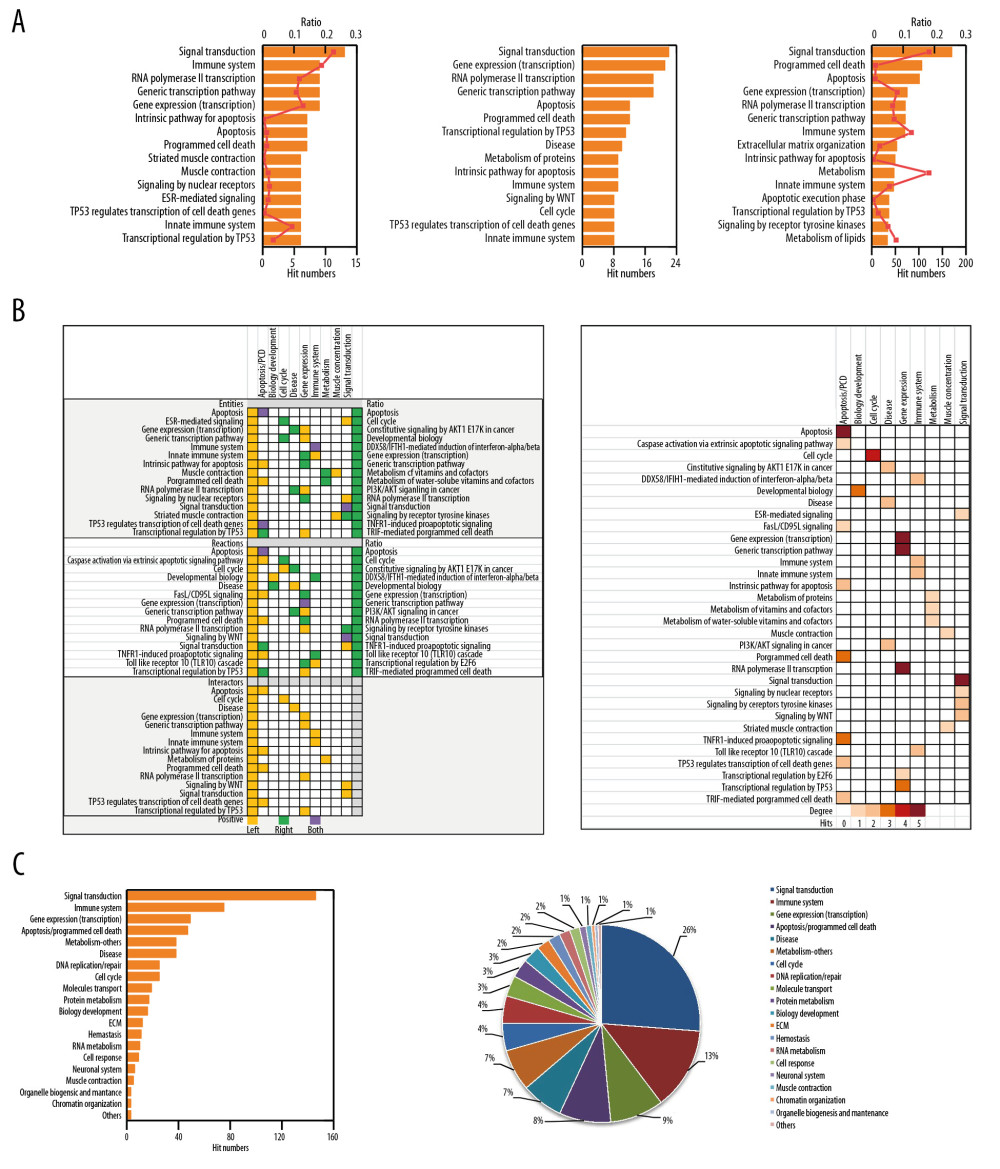
Figure 3 Classification statistics of top significant enrichment pathways from REAC analysis results as shown in Figure 2B. (A) Classification statistics of top 15 enrichment pathways. The hits of pathways (entities) and their ratio were shown in the left histogram and line combination chart. Interactors were in the middle, and reactions and their ratios were shown in the right. The hit numbers were presented as the histogram and the ratio was presented as a line chart. Top 15 pathways were used to analyze due to some pathways jointly toped 10. (B) Distribution of the top 15 pathways. (C) Subtotal analysis results of pathways enriched by REAC. Left: distribution, and Right: frequency. REAC – Reactome.