23 August 2020 : Database Analysis
Integrated Bioinformatics Analysis Reveals Potential Pathway Biomarkers and Their Interactions for Clubfoot
Jing Ding1BCDEF, Zhenpeng Liang1BCDE, Weijia Feng1EF, Qixun Cai1AG*, Ziming Zhang1AGDOI: 10.12659/MSM.925249
Med Sci Monit 2020; 26:e925249


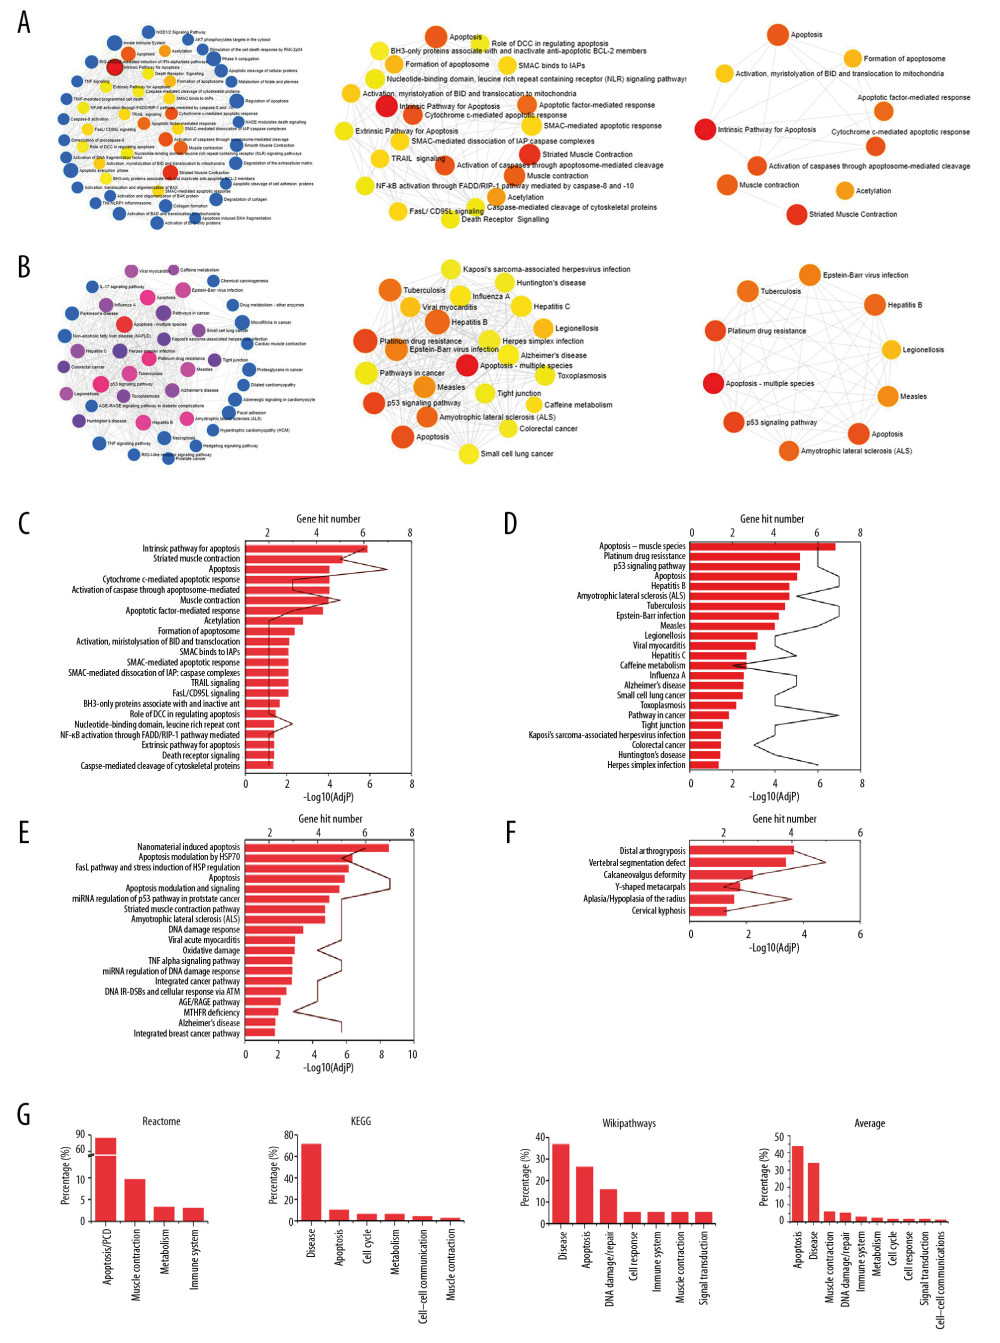
Figure 4 Pathway enrichment analysis. The size of the icon means gene hit numbers in pathways. The bigger the size, the more the gene hit numbers. Blue icons: P<0.05 but adjusted P (AdjP) >0.05. Other colors: both P value and AdjP value <0.05. The darker the color, the larger the −log10(AdjP). (A) REAC enriched analysis using NetworkAnalyst. The interactions of the signalings enriched with REAC with a P<0.05 but AdjP>0.05 (left), P<0.05 and AdjP<0.05 (middle), and top 10 interactions (right). (B) KEGG enrichment analysis by NetworkAnalyst. The interactions of the pathways enriched by REAC with a P<0.05 but AdjP value >0.05 (left), P<0.05 and AdjP<0.05 (middle), and top 10 interactions (right). Statistical results of REAC (C), KEGG (D), and WP (E) enrichment analysis by g: Profiler with a P<0.05 and AdjP<0.05. (F) HP enrichment analysis with g: Profiler. The −log10(AdjP) value was presented as the histogram and the hit gene numbers was presented as a line chart as shown in C–F. (G) The percentage of the signaling pathways in databases. The value was the average of percentage of pathways in REAC or KEGG analyzed by g: Profiler, NetworkAnalyst, and WebGestalt (Supplementary Figure 1) shown in the 3 histograms on the left. Average of percentage of pathways in REAC, KEGG, and WP was placed on the right. REAC – Reactome; GO – Gene Ontology; KEGG – Kyoto Encyclopedia of Genes and Genomes; WP – WikiPathways; HP – Human Phenotype Ontology.