23 August 2020 : Database Analysis
Integrated Bioinformatics Analysis Reveals Potential Pathway Biomarkers and Their Interactions for Clubfoot
Jing Ding1BCDEF, Zhenpeng Liang1BCDE, Weijia Feng1EF, Qixun Cai1AG*, Ziming Zhang1AGDOI: 10.12659/MSM.925249
Med Sci Monit 2020; 26:e925249


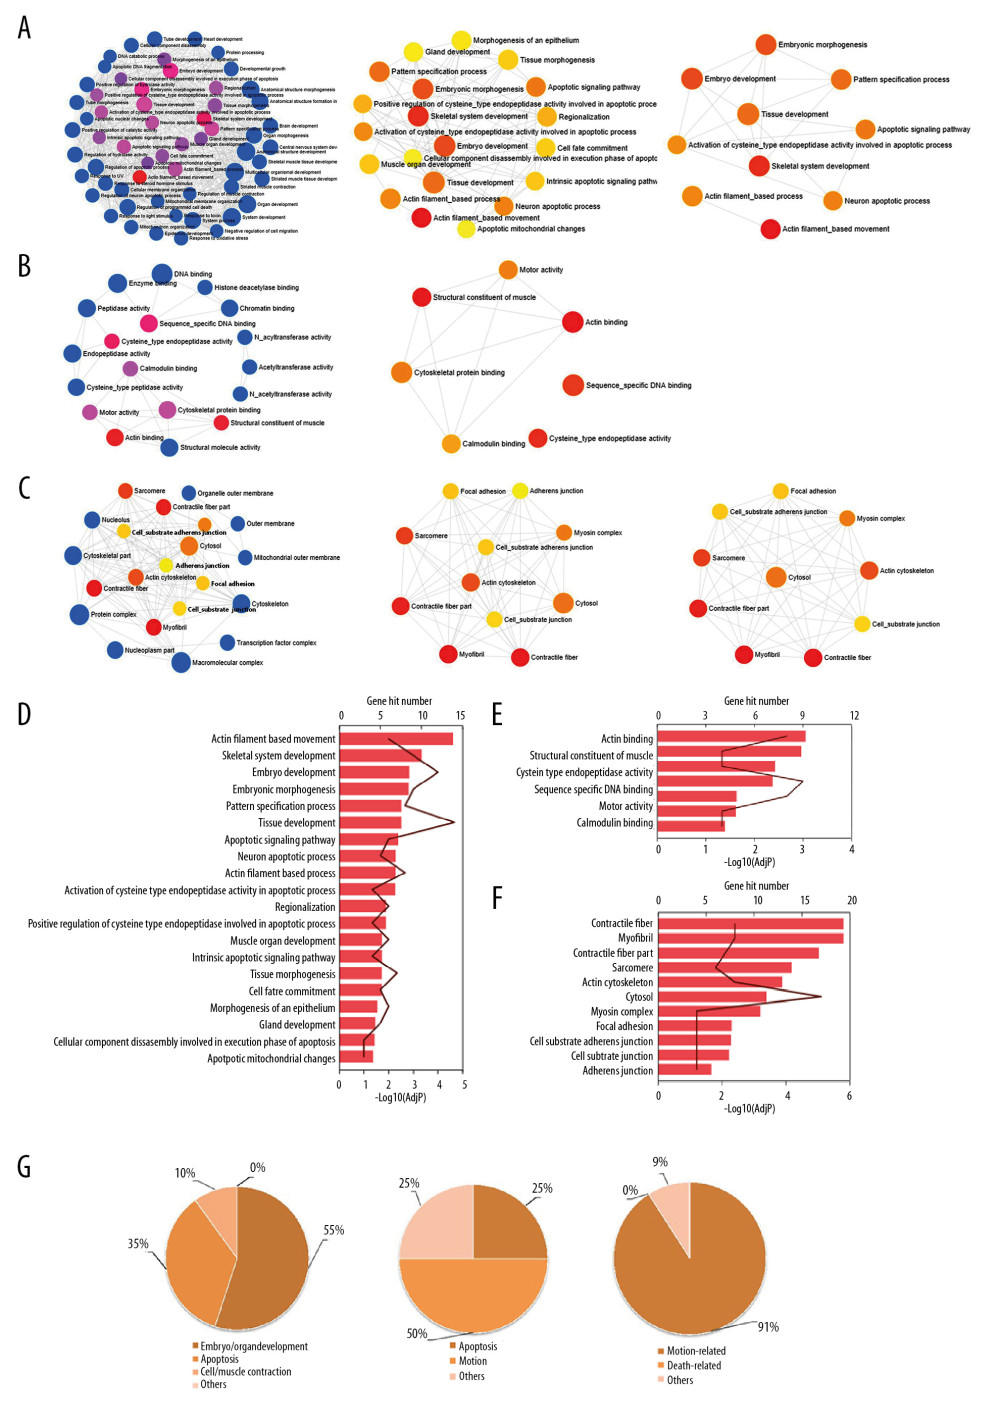
Figure 5 The enriched GO terms in the BP, MF, and CC categories for included candidate genes of clubfoot with NetworkAnalyst. The size of the icon means gene hit numbers in pathways. The bigger the size, the more the gene hit numbers. Blue icons: P<0.05 but adjusted P (AdjP) >0.05. Other colors: both P value and AdjP<0.05. The darker the color, the larger the −log10(AdjP). (A) Biological process (BP). The interactions of BP enriched by GO with a P<0.05 but AdjP>0.05 (left), P<0.05 and AdjP<0.05 (middle), and top 10 interactions (right). The size of the icon means gene hit numbers in pathways. The bigger the size, the more the gene hit numbers. Blue icons: P<0.05 but AdjP>0.05. Other colors: both P and AdjP<0.05. The darker the color, the larger the −log10(AdjP). (B) Molecular function (MF): the interactions of MF enriched by GO with a P<0.05 but AdjP>0.05 (left) and P<0.05 and AdjP<0.05 (right). (C) Cellular component (CC): the interactions of CC enriched by GO with P<0.05 but AdjP value >0.05 (left), P<0.05 and AdjP<0.05 (middle), and top 10 interactions (right). (D) Statistical results of the enriched Gene Ontology (GO) terms in BP (D), MF (E), and CC (F) categories with P<0.05 and AdjP<0.05. The −log10(AdjP) value was presented as the histogram and the hit gene numbers was presented as a line chart. (G) Summary results of the enriched GO terms. Left: BP; middle: MF; right: CC.