21 November 2020 : Database Analysis
Comprehensive Analysis of Alternative Splicing Signature in Gastric Cancer Prognosis Based on The Cancer Genome Atlas (TCGA) and SpliceSeq Databases
Xiaohu Cheng1ACEG, Xianghua Li2ACE, Yimei Gu3AE, Lianbang Zhou1AE, Jingjing Tang1B, Xiang Dai1B, Heng Jiang1B, Yang Huang1B, Yingfeng Zhang1B, Tongtong Xu1B, Zhining Liu1AE*, Qihong Zhao4AEDOI: 10.12659/MSM.925772
Med Sci Monit 2020; 26:e925772


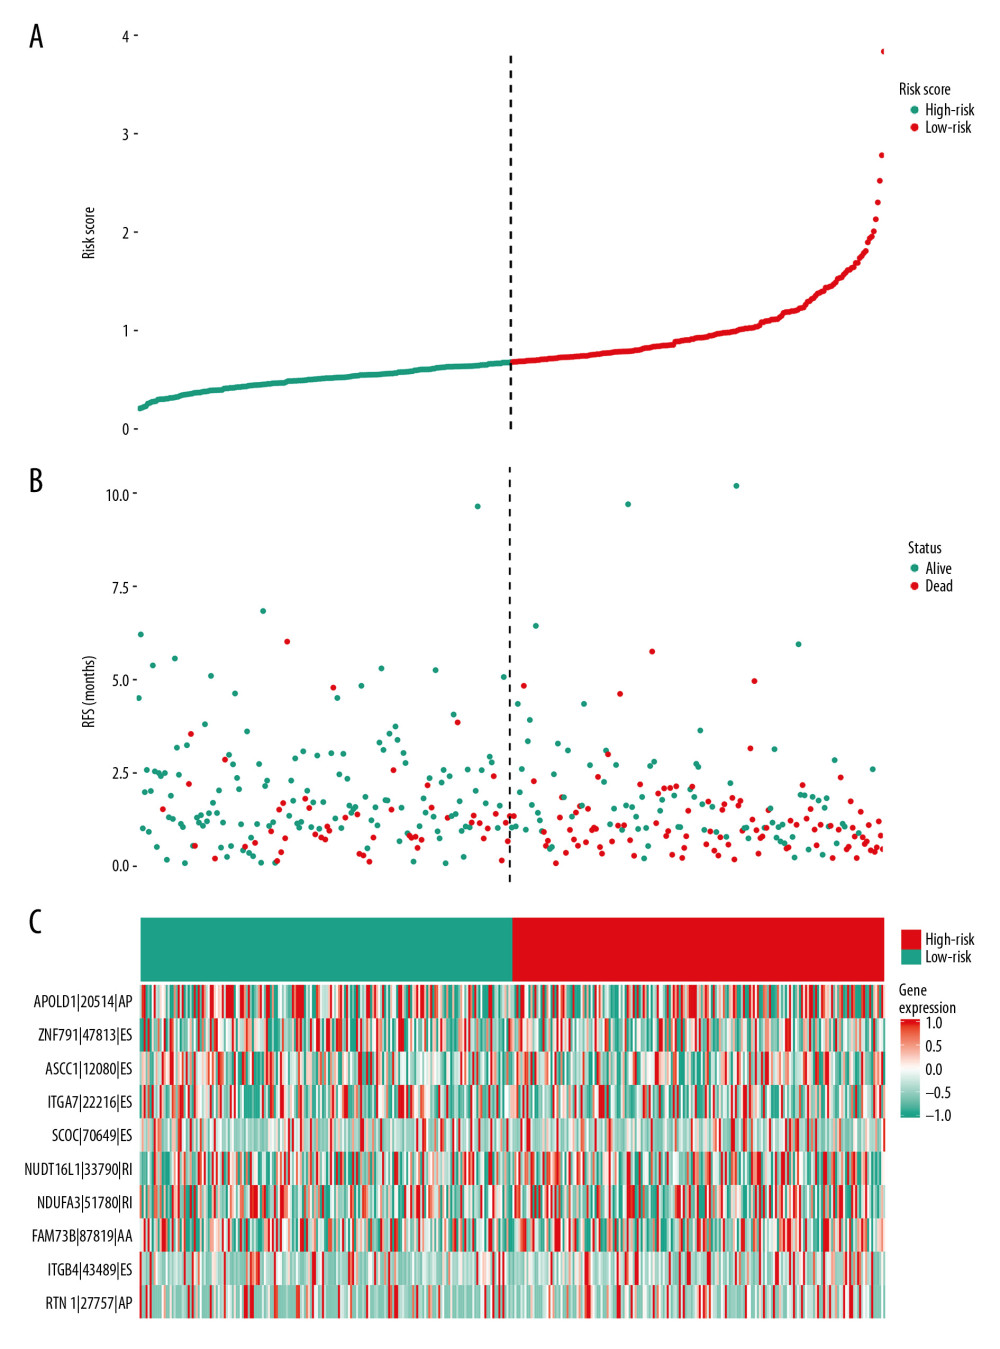
Figure 5 mRNA signature risk score distribution, heatmap of the mRNA expression profiles. Rows represent mRNAs, and columns represent patients. (A) The risk score curve, red dots show high-risk samples and while green dots show low-risk samples. (B) Distribution of patients’ survival status and overall survival (OS) times classified with risk scores, red dots indicate dead while green dots indicate alive. (C) Heatmap displays splicing pattern of the mRNA signatures. Color transition from green to red indicates the increasing PSI score of corresponding genes expression from low to high.