06 October 2020 : Database Analysis
Creation of a Prognostic Risk Prediction Model for Lung Adenocarcinoma Based on Gene Expression, Methylation, and Clinical Characteristics
Honggang Ke1CD, Yunyu Wu2DEF, Runjie Wang3CDF, Xiaohong Wu4AB*DOI: 10.12659/MSM.925833
Med Sci Monit 2020; 26:e925833


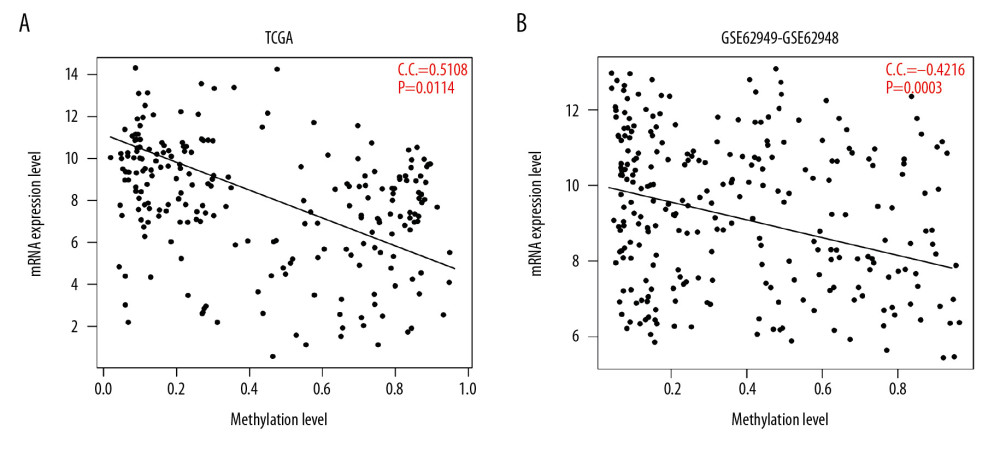
Figure 3 Correlation analysis of expression levels and methylation levels of 265 genes in (A) TCGA and (B) the GSE62950 dataset. The horizontal axis represents the gene expression level, the vertical axis represents the gene methylation level, the oblique line represents the trend line synthesized by points, and the red font represents the correlation coefficient (CC) and the significant P value.