06 October 2020 : Database Analysis
Creation of a Prognostic Risk Prediction Model for Lung Adenocarcinoma Based on Gene Expression, Methylation, and Clinical Characteristics
Honggang Ke1CD, Yunyu Wu2DEF, Runjie Wang3CDF, Xiaohong Wu4AB*DOI: 10.12659/MSM.925833
Med Sci Monit 2020; 26:e925833


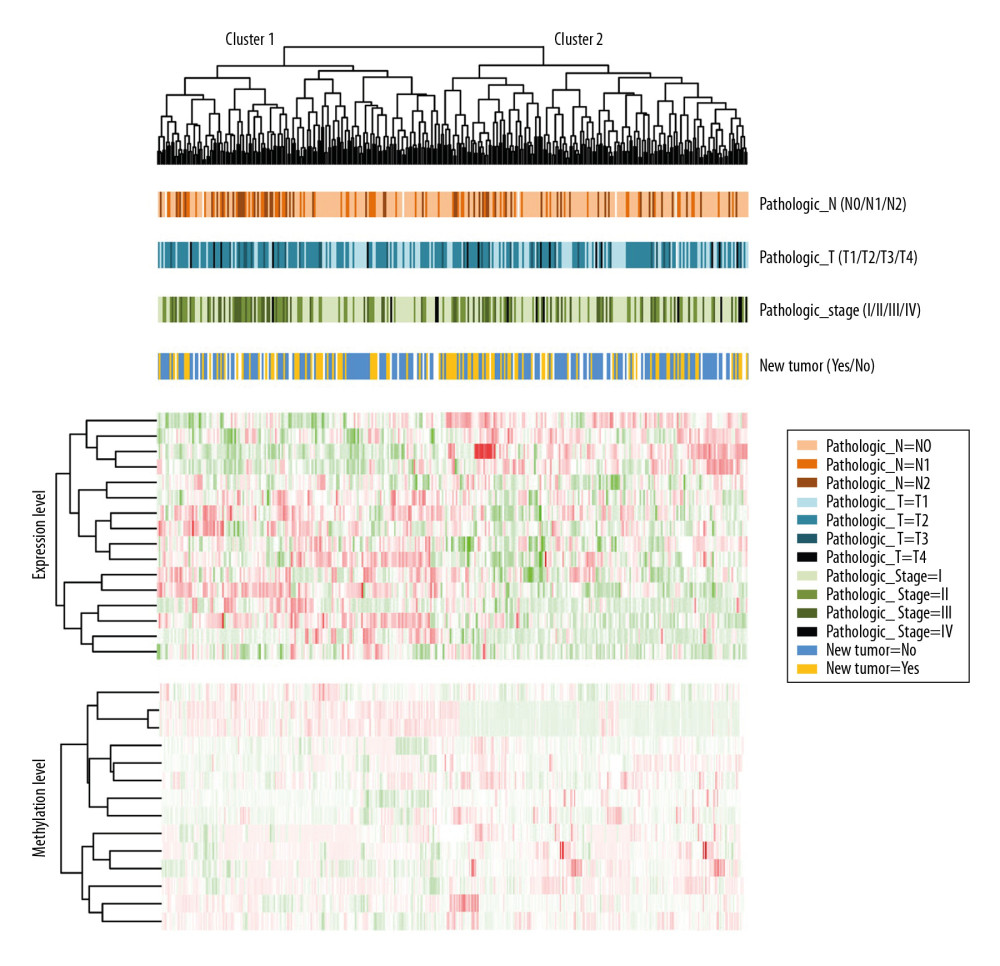
Figure 4 Bidirectional hierarchical cluster heatmaps based on 16 gene expression and methylation levels. The first line under the cluster tree represents pathologic N information, and the change from light orange to deep orange represents N0 to N2. The second line represents the pathologic T information, and the change from light blue to dark blue represents T1 to T4. The third line represents pathologic stage information, and the change from light green to dark green represents stages I to IV. The fourth line represents new tumor information, and the blue and gold represent the samples without and with new tumor, respectively.