18 September 2020 : Database Analysis
Development and Validation of a Prognostic Prediction Model for Postoperative Ovarian Sex Cord-Stromal Tumor Patients
Danming You1ABCDEF, Zuyu Zhang1CDE, Mingzhu Cao2AG*DOI: 10.12659/MSM.925844
Med Sci Monit 2020; 26:e925844


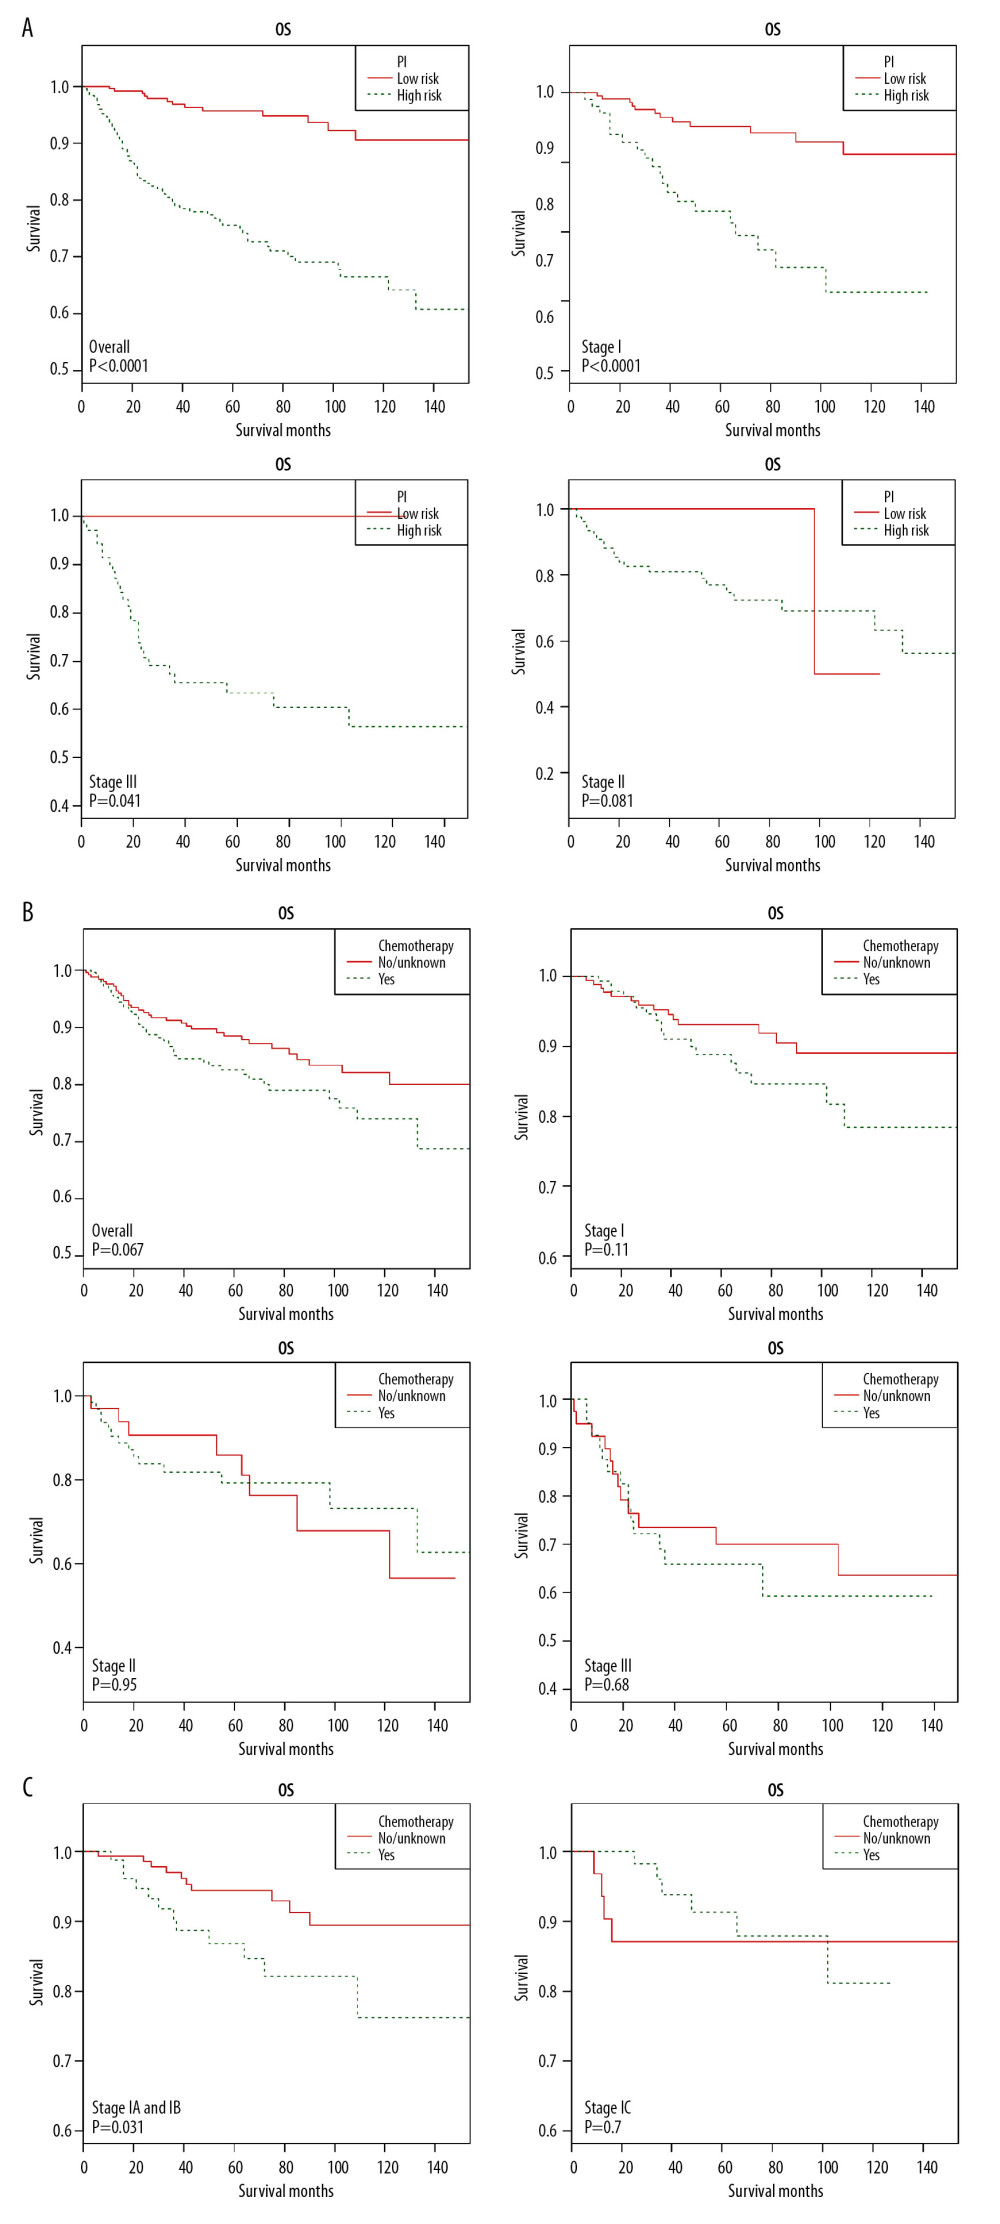
Figure 5 Overall survival (OS) of SCST patients who underwent surgery. Kaplan-Meier survival curve for patients with sex cord-stromal tumors. (A) Patients grouped by median value of prognostic index (PI) according to FIGO stages. Red lines represent low-risk groups, green lines represent high-risk groups. (B, C) Patients at different FIGO stages stratified by whether they received chemotherapy or not. Red lines represent patients without or unknown if received chemotherapy, green lines represent patients who received chemotherapy.