18 September 2020 : Database Analysis
Development and Validation of a Prognostic Prediction Model for Postoperative Ovarian Sex Cord-Stromal Tumor Patients
Danming You1ABCDEF, Zuyu Zhang1CDE, Mingzhu Cao2AG*DOI: 10.12659/MSM.925844
Med Sci Monit 2020; 26:e925844


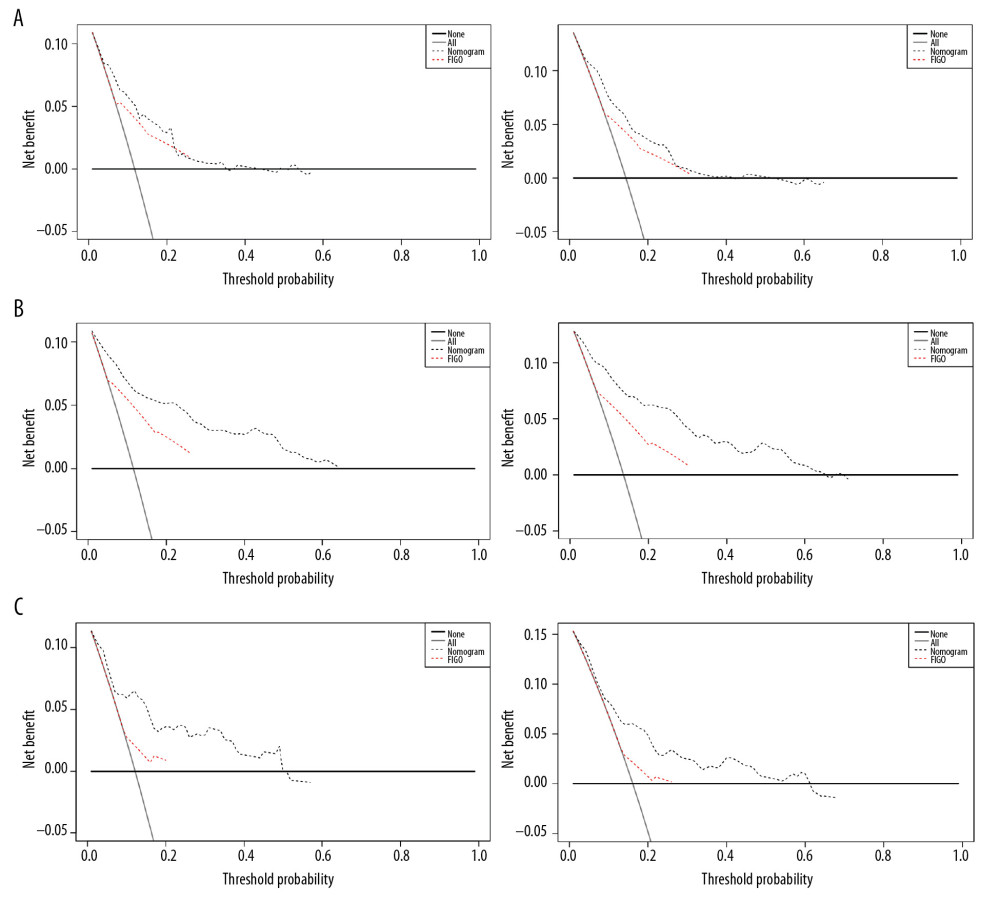
Figure 6 Decision curve analysis for nomogram and FIGO stage. The nomogram was compared to FIGO stage model in regard to 3- (left) and 5-year (right) overall survival (A) in the overall study population, (B) in the training set, and (C) in the validation set. The y-axis represents net benefit while the x-axis stands for the threshold probability. “All” refers to the assumption that all patients reached the endpoint and “none” to the hypothesis that no patients reached the endpoint.