27 August 2020 : Database Analysis
Addressing Global Inequities in Positron Emission Tomography-Computed Tomography (PET-CT) for Cancer Management: A Statistical Model to Guide Strategic Planning
Miguel Gallach1ABCDEF*, Miriam Mikhail Lette1ABCDEFG, May Abdel-Wahab2EG, Francesco Giammarile1EF, Olivier Pellet1E, Diana Paez1ABCDEFGDOI: 10.12659/MSM.926544
Med Sci Monit 2020; 26:e926544


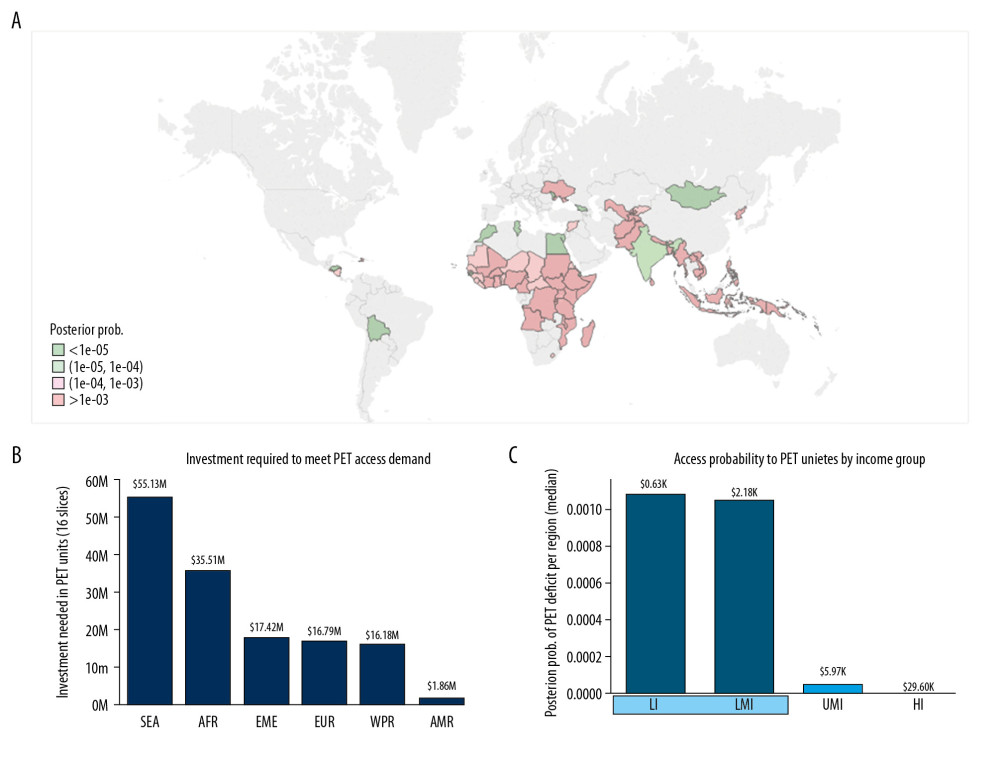
Figure 2 LMI and LI countries that could benefit the most from upscaling PET-CT scanners to address the burden of 6 cancer types. Using the WHO region classification and the World Bank income stratification. (A) World map showing the posterior probability of PET-CT scanner deficits. Greens: values below the median. Pinks: values above the median. Median: 1e-04. (B) Investment needed to overcome the deficit of PET-CT scanners. (C) Posterior probability of PET-CT service deficits per income group. Median gross national income per capita is also given for each group (data from the World Bank).