27 August 2020 : Database Analysis
Addressing Global Inequities in Positron Emission Tomography-Computed Tomography (PET-CT) for Cancer Management: A Statistical Model to Guide Strategic Planning
Miguel Gallach1ABCDEF*, Miriam Mikhail Lette1ABCDEFG, May Abdel-Wahab2EG, Francesco Giammarile1EF, Olivier Pellet1E, Diana Paez1ABCDEFGDOI: 10.12659/MSM.926544
Med Sci Monit 2020; 26:e926544


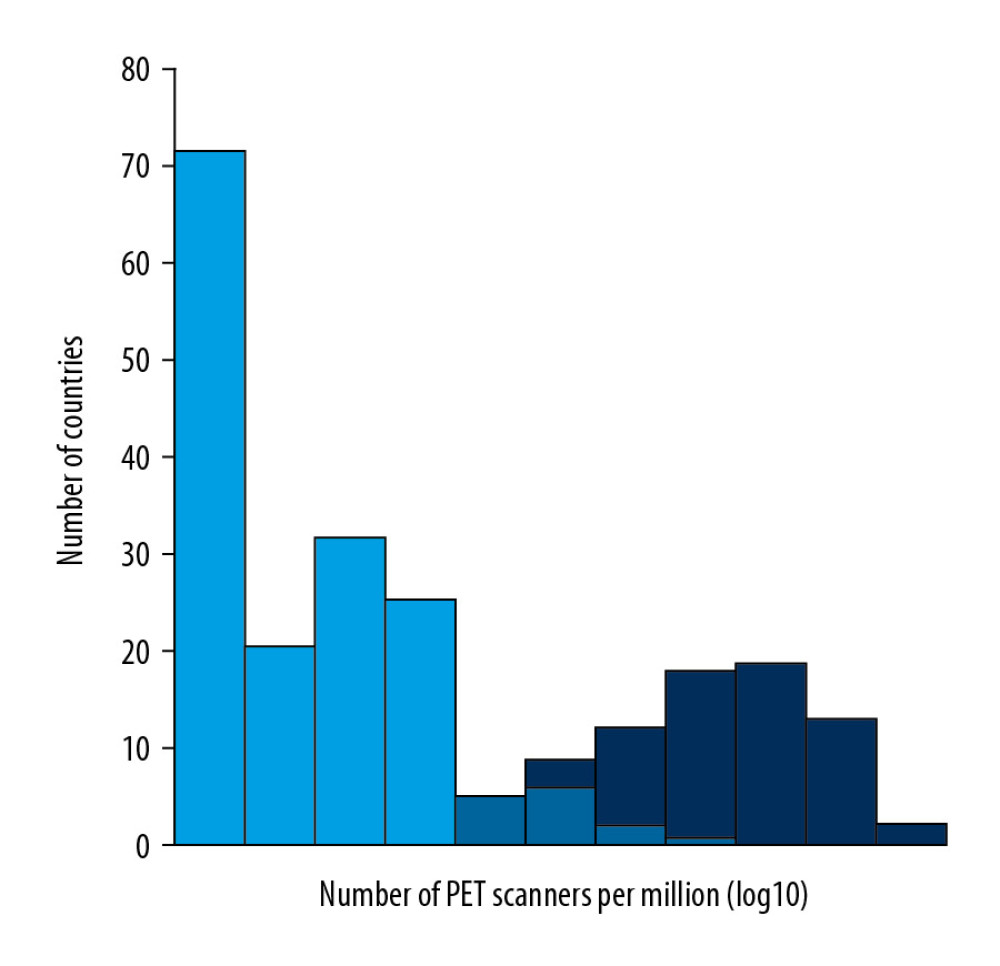
Figure 5 Frequency of PET-CT scanner provision. Dark blue: countries that would not require additional PET-CT scanners to fulfill their cancer patient needs according to our model. Mean and median: 1.44 and 0.96 PET-CT scanners per million inhabitants, respectively. Light blue: countries that would require more PET-CT scanners according to our model. Mean and median: 0.04 and 10−05 PET-CT scanners per million inhabitants, respectively. Note the overlapping region between both distributions, which expands from 0.04 to 0.8 PET-CT scanners per million inhabitants.0