15 August 2020 : Clinical Research
Visual Interpretability in Computer-Assisted Diagnosis of Thyroid Nodules Using Ultrasound Images
Xi Wei1ADEFG, Jialin Zhu1ACDEF*, Haozhi Zhang2CDF, Hongyan Gao3BCF, Ruiguo Yu4BCD, Zhiqiang Liu4BCD, Xiangqian Zheng2BF, Ming Gao2AF, Sheng Zhang1ABDEFDOI: 10.12659/MSM.927007
Med Sci Monit 2020; 26:e927007


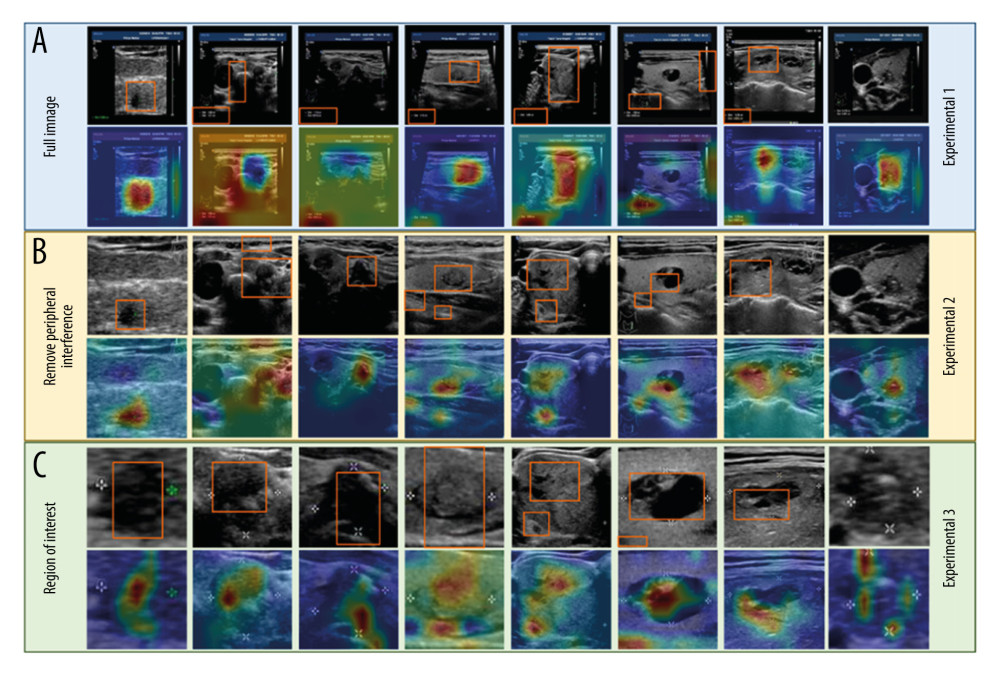
Figure 1 Corresponding visualization results are shown for experiments 1–3. The areas of the orange frames represent the visualization results on the datasets. Each column shows the same ultrasound image with different degrees of segmentation. (A) Experiment 1: The model was trained and tested using full images. (B) Experiment 2: The model was trained and tested using images after the removal of peripheral interference. (C) Experiment 3: The model was trained and tested using the region of interest (ROI).