15 August 2020 : Clinical Research
Visual Interpretability in Computer-Assisted Diagnosis of Thyroid Nodules Using Ultrasound Images
Xi Wei1ADEFG, Jialin Zhu1ACDEF*, Haozhi Zhang2CDF, Hongyan Gao3BCF, Ruiguo Yu4BCD, Zhiqiang Liu4BCD, Xiangqian Zheng2BF, Ming Gao2AF, Sheng Zhang1ABDEFDOI: 10.12659/MSM.927007
Med Sci Monit 2020; 26:e927007


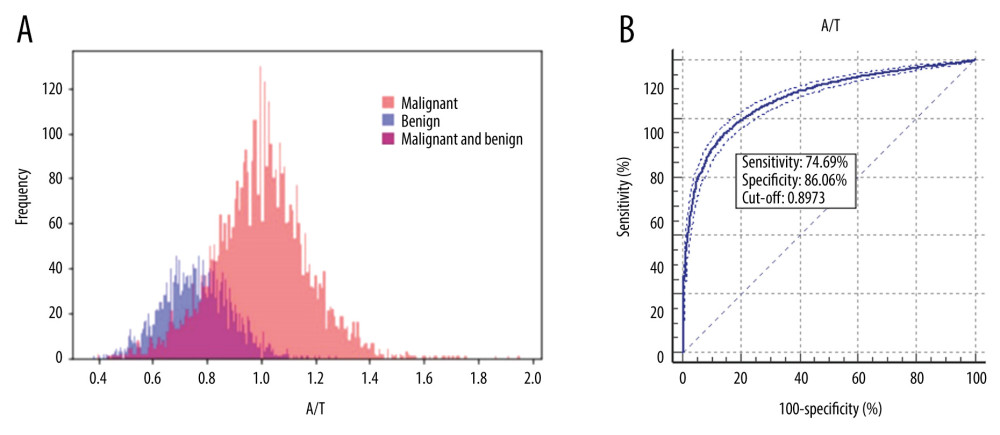
Figure 5 The plot of the A/T ratio experiments of thyroid nodules is shown in A: the pink area represents the distribution area of malignant nodules, the blue area represents the distribution area of benign nodules, and the purple area in the middle is the overlap area of both malignant and benign nodules. The receiver operating characteristic (ROC) curve of the A/T ratio in the diagnosis of thyroid nodules is demonstrated in B.