20 December 2020 : Animal Research
Effect of Asthma on Erectile Dysfunction in Rats as Determined by Biological Network Analysis
Jisheng Wang12ABCDEF, Xuefeng Gong3ABCDEF, Sheng Deng12ABCDEF, Fanchao Meng12CDE, Hengheng Dai12DEF, Binghao Bao12CD, Junlong Feng12BF, Haisong Li2AFG*, Bin Wang2AFGDOI: 10.12659/MSM.927491
Med Sci Monit 2020; 26:e927491


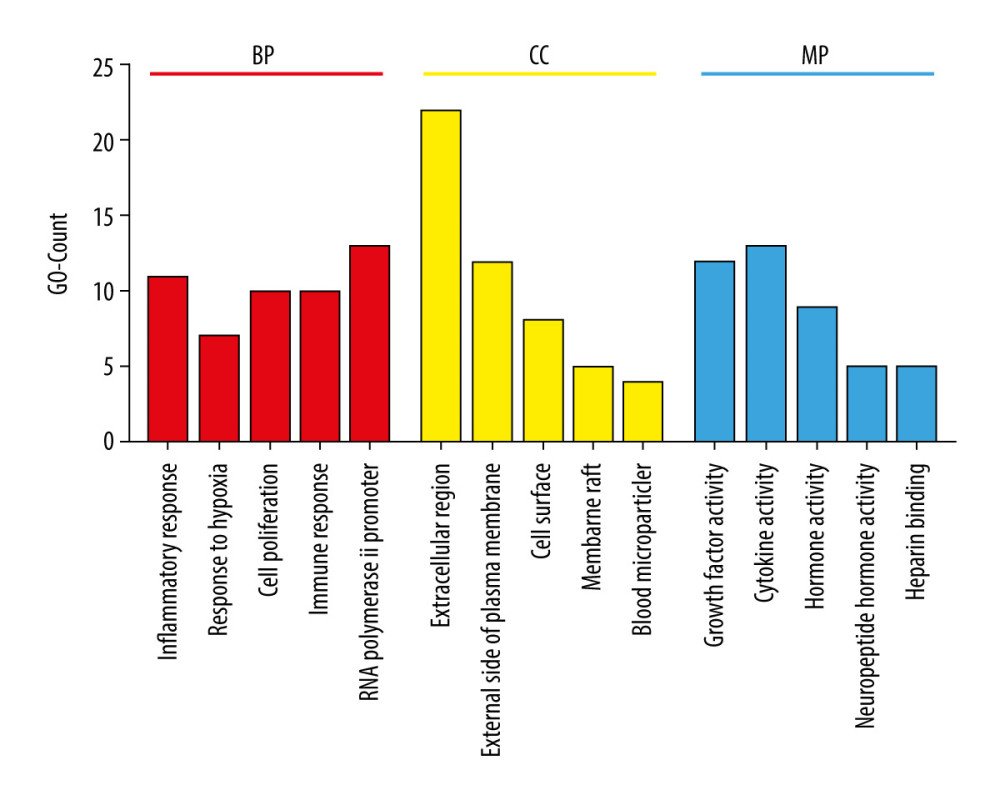
Figure 5 Gene ontology enrichment analysis. The x axis is the top 5 results of biological processes (BP), cell components (CC), and molecular function (MF) P values. The y axis is the number of enriched targets (count). The red bar represents BP, the yellow bar represents CC, and the blue bar represents MF.