04 March 2021 : Database Analysis
Specific Lung Squamous Cell Carcinoma Prognosis-Subtype Distinctions Based on DNA Methylation Patterns
Guichuan Huang1ABE*, Jing Zhang2B, Ling Gong1D, Daishun Liu1G, Xin Wang3F, Yi Chen3B, Shuliang Guo3ADOI: 10.12659/MSM.929524
Med Sci Monit 2021; 27:e929524


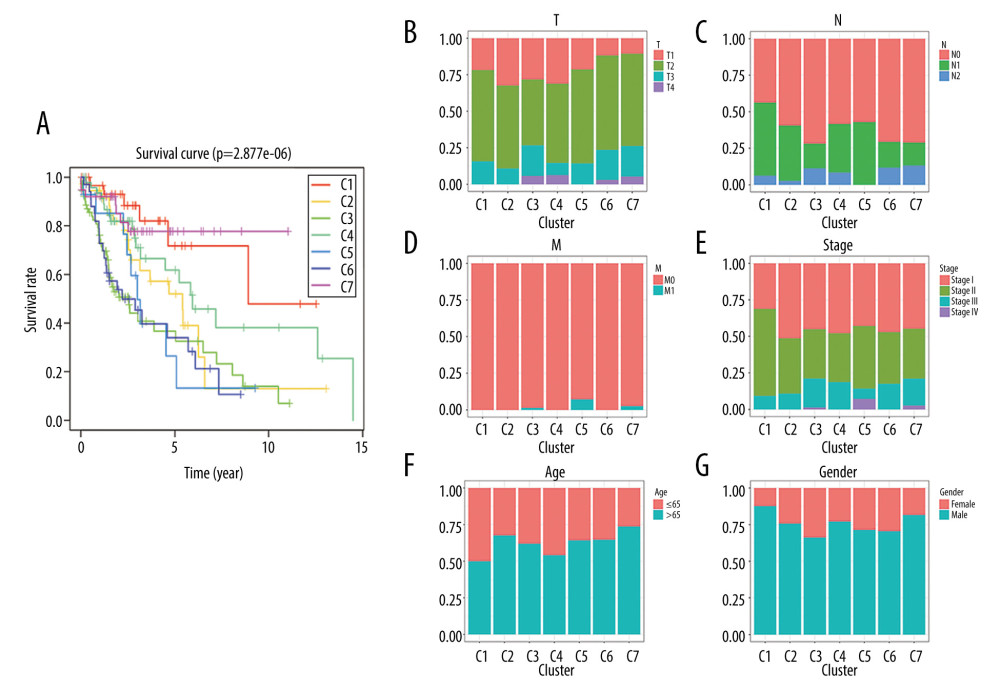
Figure 4 Characterization of 7 DNA clusters. (A) The survival curves of each DNA methylation subgroups. The horizontal axis represents the survival time (years) and the vertical axis represents the survival rate. Distribution of T (B), N (C), M (D), TNM stage (E), age (F), and sex (G) in the 7 clusters. The horizontal axis represents the DNA methylation clusters and the vertical axis represents the proportion of samples.