24 March 2021 : Database Analysis
Genome-Scale Analysis Identified NID2, SPARC, and MFAP2 as Prognosis Markers of Overall Survival in Gastric Cancer
Zexing Shan1ACDE, Wentao Wang1B, Yilin Tong1B, Jianjun Zhang1B*DOI: 10.12659/MSM.929558
Med Sci Monit 2021; 27:e929558


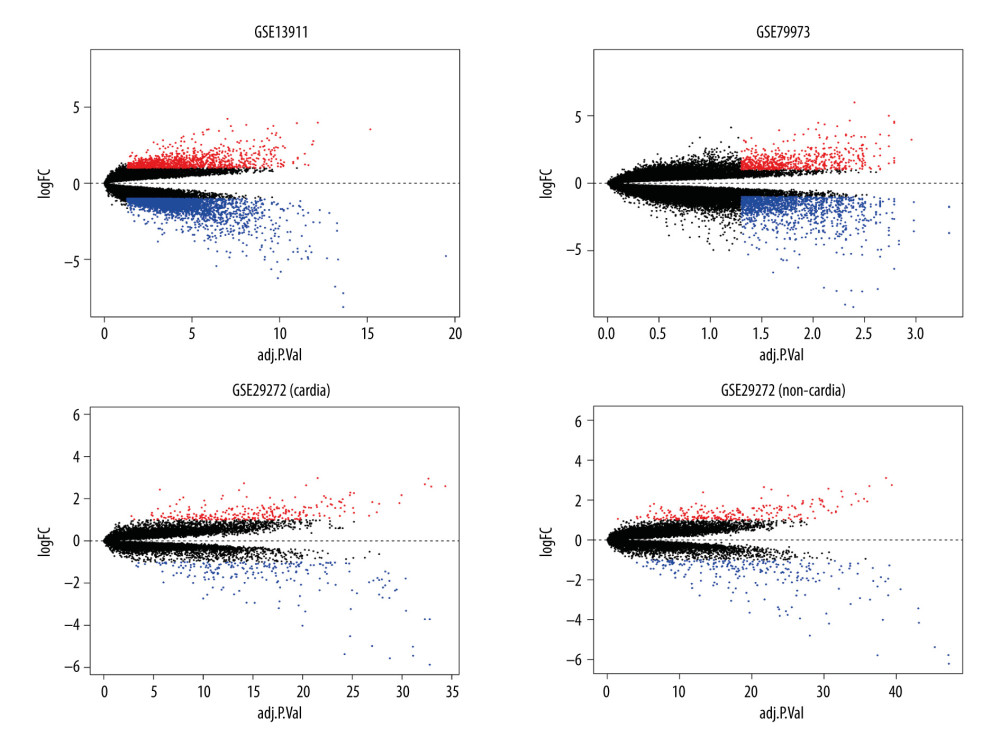
Figure 2 Identification of differentially expressed genes. Visualization of the identified differentially expressed genes was performed by volcano plots. Dots represent genes with color coding: red indicates upregulated, blue indicates downregulated, and black indicates genes that are not differentially expressed.