22 July 2021 : Database Analysis
Identification of Key Genes and Underlying Mechanisms in Acute Kawasaki Disease Based on Bioinformatics Analysis
Side Gao1BCDEF, Wenjian Ma1BCD, Xuze Lin1BCD, Sizhuang Huang1BC, Mengyue Yu1AG*DOI: 10.12659/MSM.930547
Med Sci Monit 2021; 27:e930547


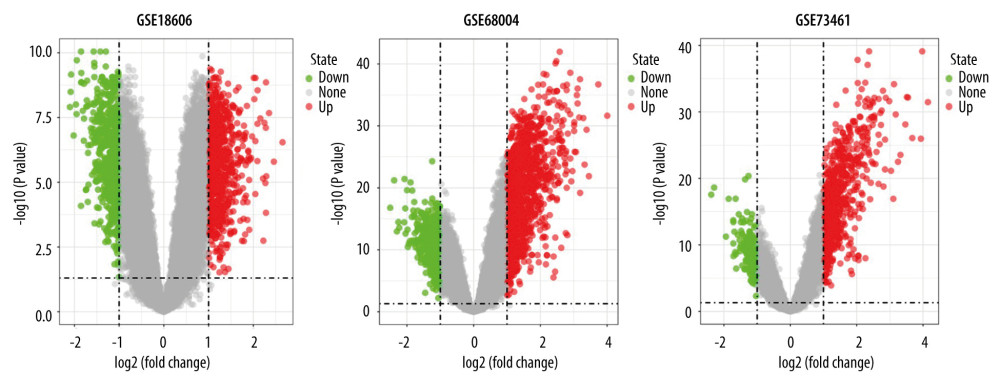
Figure 2 Volcano plots showing the DEGs in each GSE dataset. The x-axis was log2 (foldchange) and y-axis was −log10 (P value) in volcano plots. The red dots indicate upregulated genes, and green dots indicate downregulated genes.