22 July 2021: Database Analysis
Identification of Key Genes and Underlying Mechanisms in Acute Kawasaki Disease Based on Bioinformatics Analysis
Side Gao BCDEF , Wenjian Ma BCD , Xuze Lin BCD , Sizhuang Huang BC , Mengyue Yu AG*DOI: 10.12659/MSM.930547
Med Sci Monit 2021; 27:e930547

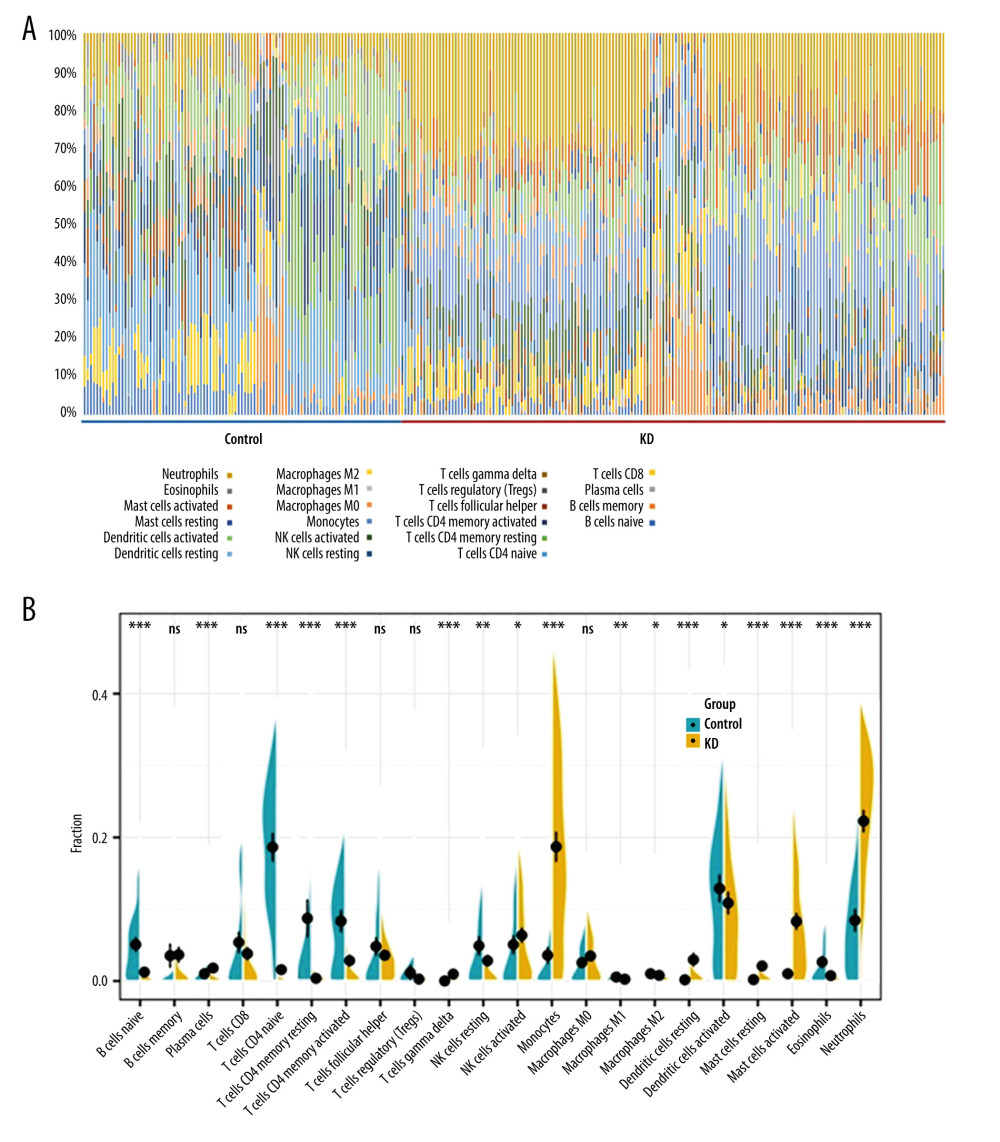
Figure 7 Immune cell infiltration analysis of the shared DEGs showing the infiltration levels of 22 immune cell subtypes in KD and controls. (A) Stacked bar chart showing deviations of immune infiltration in each control or KD sample among the 3 datasets. (B) Violin plot showing differences in proportions of each immune cell type between control and KD groups. * P<0.05, ** P<0.01, *** P<0.001, ns: not significant.


