17 August 2021 : Animal Research
Microarray Analysis of Differential Gene Expression Between Traumatic Temporomandibular Joint Fibrous and Bony Ankylosis in a Sheep Model
Tong-Mei ZhangBCDEF, Kun YangBCD, Su-Xia LiangAB, Yuan-Yuan TianCD, Zhao-Yuan XuBC, Hao LiuABCDG, Ying-Bin YanABCDEFGDOI: 10.12659/MSM.932545
Med Sci Monit 2021; 27:e932545


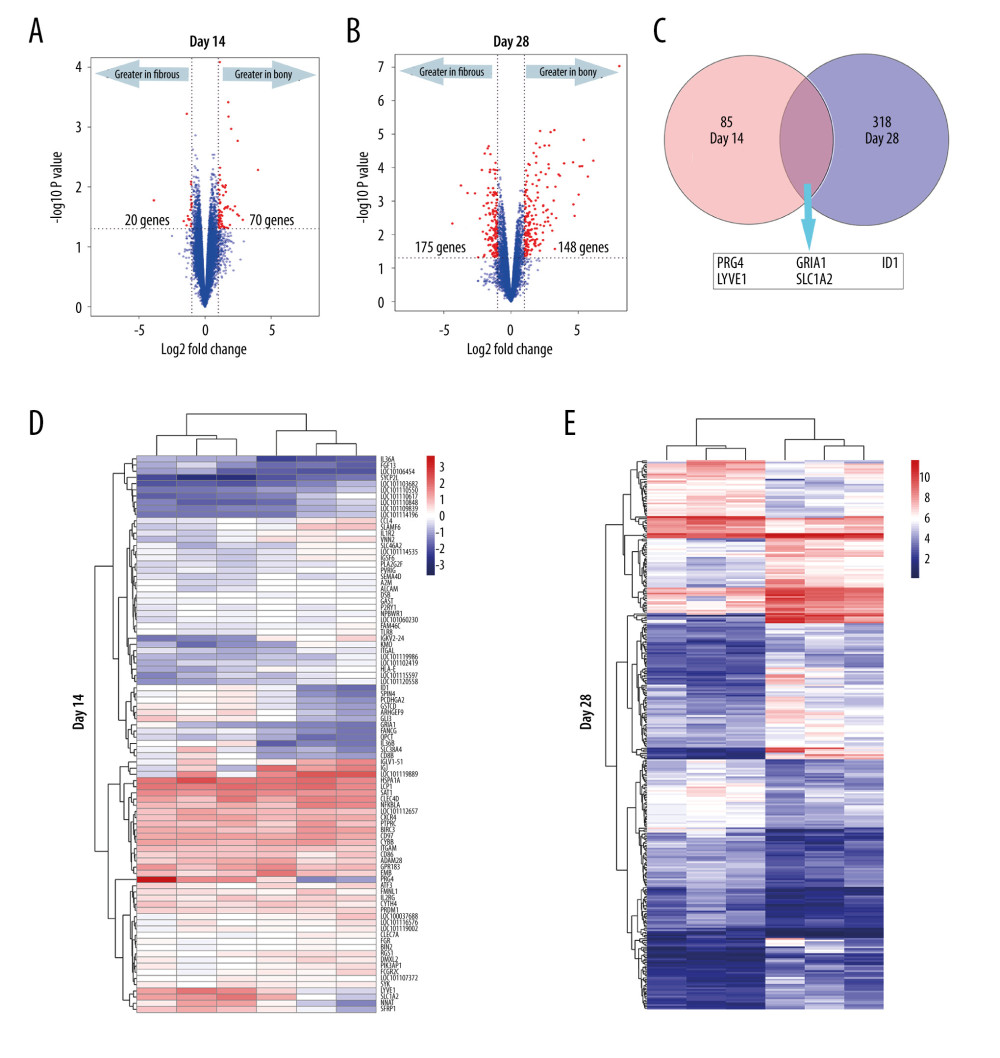
Figure 2 DEGs (fold-change >2, P<0.05) in the microarray profiles. (A) Volcano plot of 3 paired fibrous and bony ankylosed samples at day 14. (B) Volcano plot of 3 paired fibrous and bony ankylosed samples at day 28. (C) Venn diagram indicating that 5 mRNAs are co-expressed at both 2 time-points and their gene symbol are PRG4, GRIA1, LYVE1, ID1, SLC7A2. (D) Heat map of 3 paired fibrous and bony ankylosed samples at day 14. (E) Heat map of 3 paired fibrous and bony ankylosed samples at day 28. Different colors represent different expression levels (red high expression, white medium expression, and blue low expression). DEGs – differentially expressed genes.