17 August 2021 : Animal Research
Microarray Analysis of Differential Gene Expression Between Traumatic Temporomandibular Joint Fibrous and Bony Ankylosis in a Sheep Model
Tong-Mei ZhangBCDEF, Kun YangBCD, Su-Xia LiangAB, Yuan-Yuan TianCD, Zhao-Yuan XuBC, Hao LiuABCDG, Ying-Bin YanABCDEFGDOI: 10.12659/MSM.932545
Med Sci Monit 2021; 27:e932545


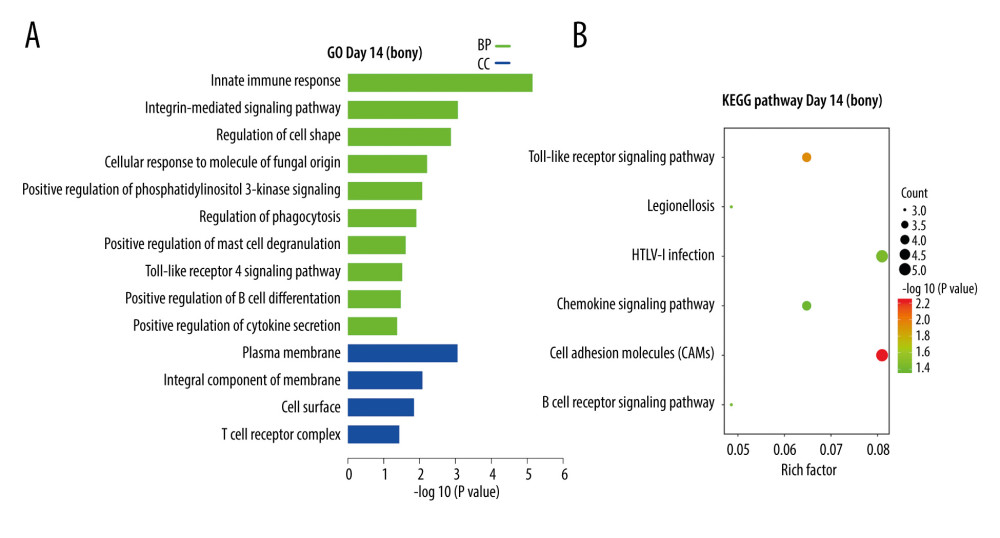
Figure 3 KEGG and GO enrichment analysis for day14. (A) GO analysis of DEGs upregulated in bony ankylosis. The abscissa represents the −log10 (P value) of enrichment term, and the ordinate represents the enrichment term’s names. (B) The KEGG pathway analysis of DEGs upregulated in bony ankylosis. The size of the circle represents gene count. The x-axis represents rich factor, and the y-axis represents pathway. Different circle colors represent different adjusted P values. GO – gene ontology; BP – biological process; CC – cellular component; MF – molecular function; KEGG – Kyoto Encyclopedia of Genes and Genomes; DEGs – differentially expressed genes.