20 December 2021 : Database Analysis
Identification of Feature Autophagy-Related Genes and DNA Methylation Profiles in Systemic Lupus Erythematosus Patients
Bo Gao1ACE*DOI: 10.12659/MSM.933425
Med Sci Monit 2021; 27:e933425


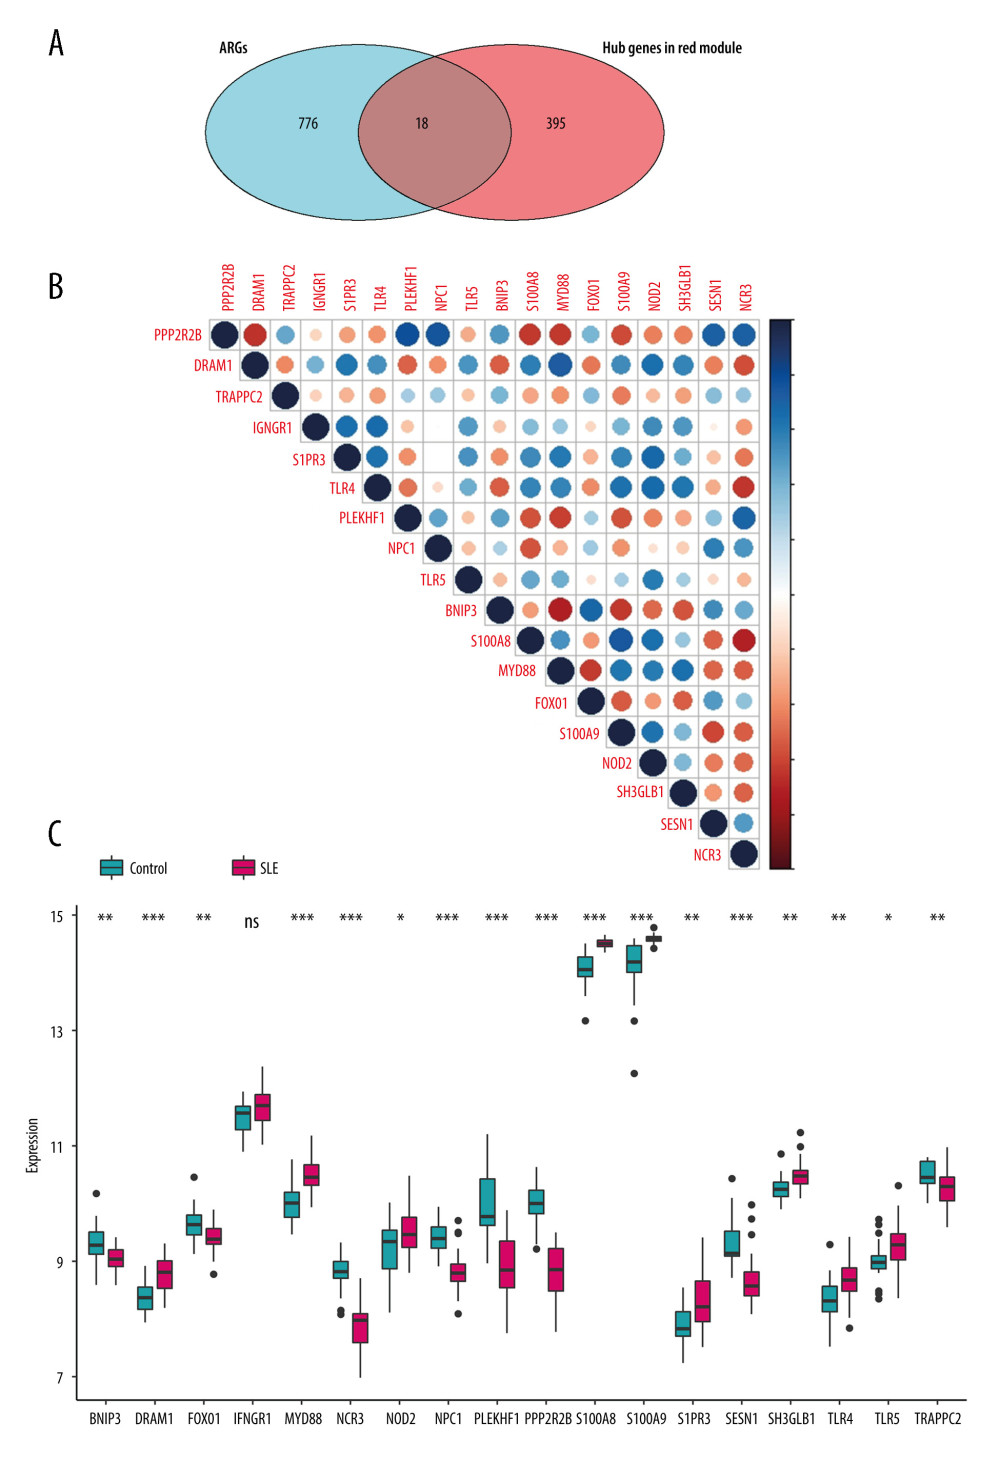
Figure 4 Identification of feature ARGs. (A) Selection of real hub genes in the ARGs and red modules. (B) Correlation heatmap shows gene co-expression patterns among ARGs. The colors represent correlations, and the size of the circles represent the size of the p values. (C) Boxplot shows the median expression level of each ARGs in both control and SLE samples, represented by red and green boxes, respectively.