23 March 2022 : Animal Research
Analysis of Genes Associated with Both Neural Tube Defects and Neuroectodermal Tumors
Rui Cao12ABCDEFG*, Jiaqi Li1C, Li Zhang13CE, Jianting Li1AE, Yuxiang Liang1C, Ruifang Ao1F, Ying Wang1D, Hang Li1D, Xin Lu1D, Zhizhen Liu1A, Hong Zhao1AB, Jun Xie1AEGDOI: 10.12659/MSM.936079
Med Sci Monit 2022; 28:e936079


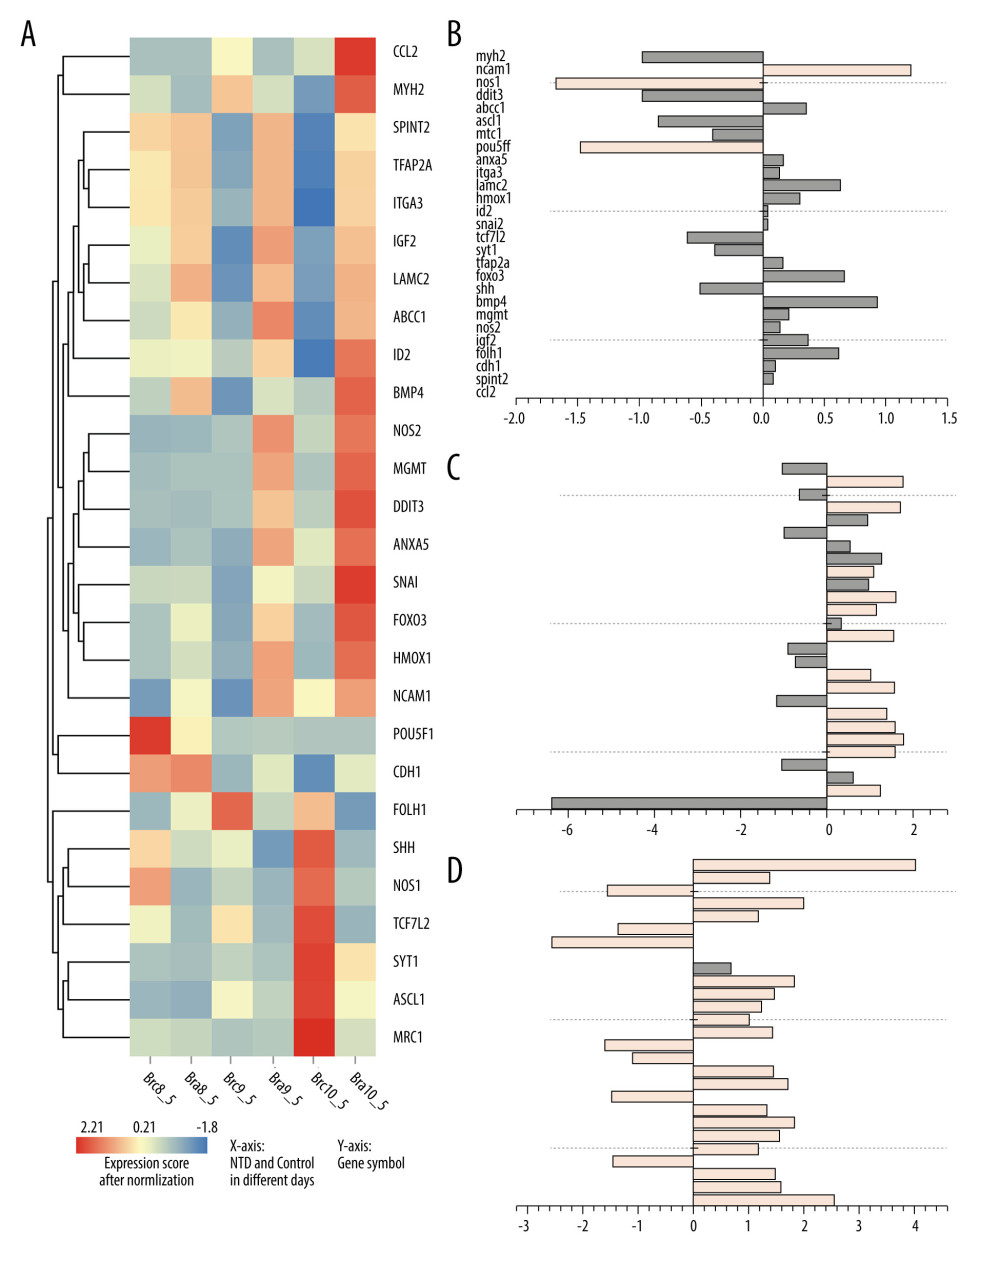
Figure 2 Expression of 27 differentially expressed gene in E8.5, E9.5, and E10.5. (A) Heatmap of DGEs’ expression; (B–D) X-axis: Log2 Ratio in E8.5 (RA/Con), Log2 Ratio in E9.5 (RA/Con), Log2 Ratio in E10.5 (RA/Con) respectively, Y-axis: Gene Symbol. Flesh colored: genes with |log2 Ratio|>1 and P value<0.05; light gray: genes with |log2 Ratio|<1 or P value>0.05. These figures were created by an open-source tool RStudio, version 1.1.456.