15 June 2022 : Animal Research
Differential circRNA and mRNA Expression Profiling During Osteogenic Differentiation in Rat Bone Marrow Mesenchymal Stem Cells
Yuan Yao1ABCDEFG, Jialin Liu1BDE, Wenjing Zhang2BC, Xiangzhen Han1G, Huiyu He1AD*, Xiaowei Ji1DEDOI: 10.12659/MSM.936761
Med Sci Monit 2022; 28:e936761


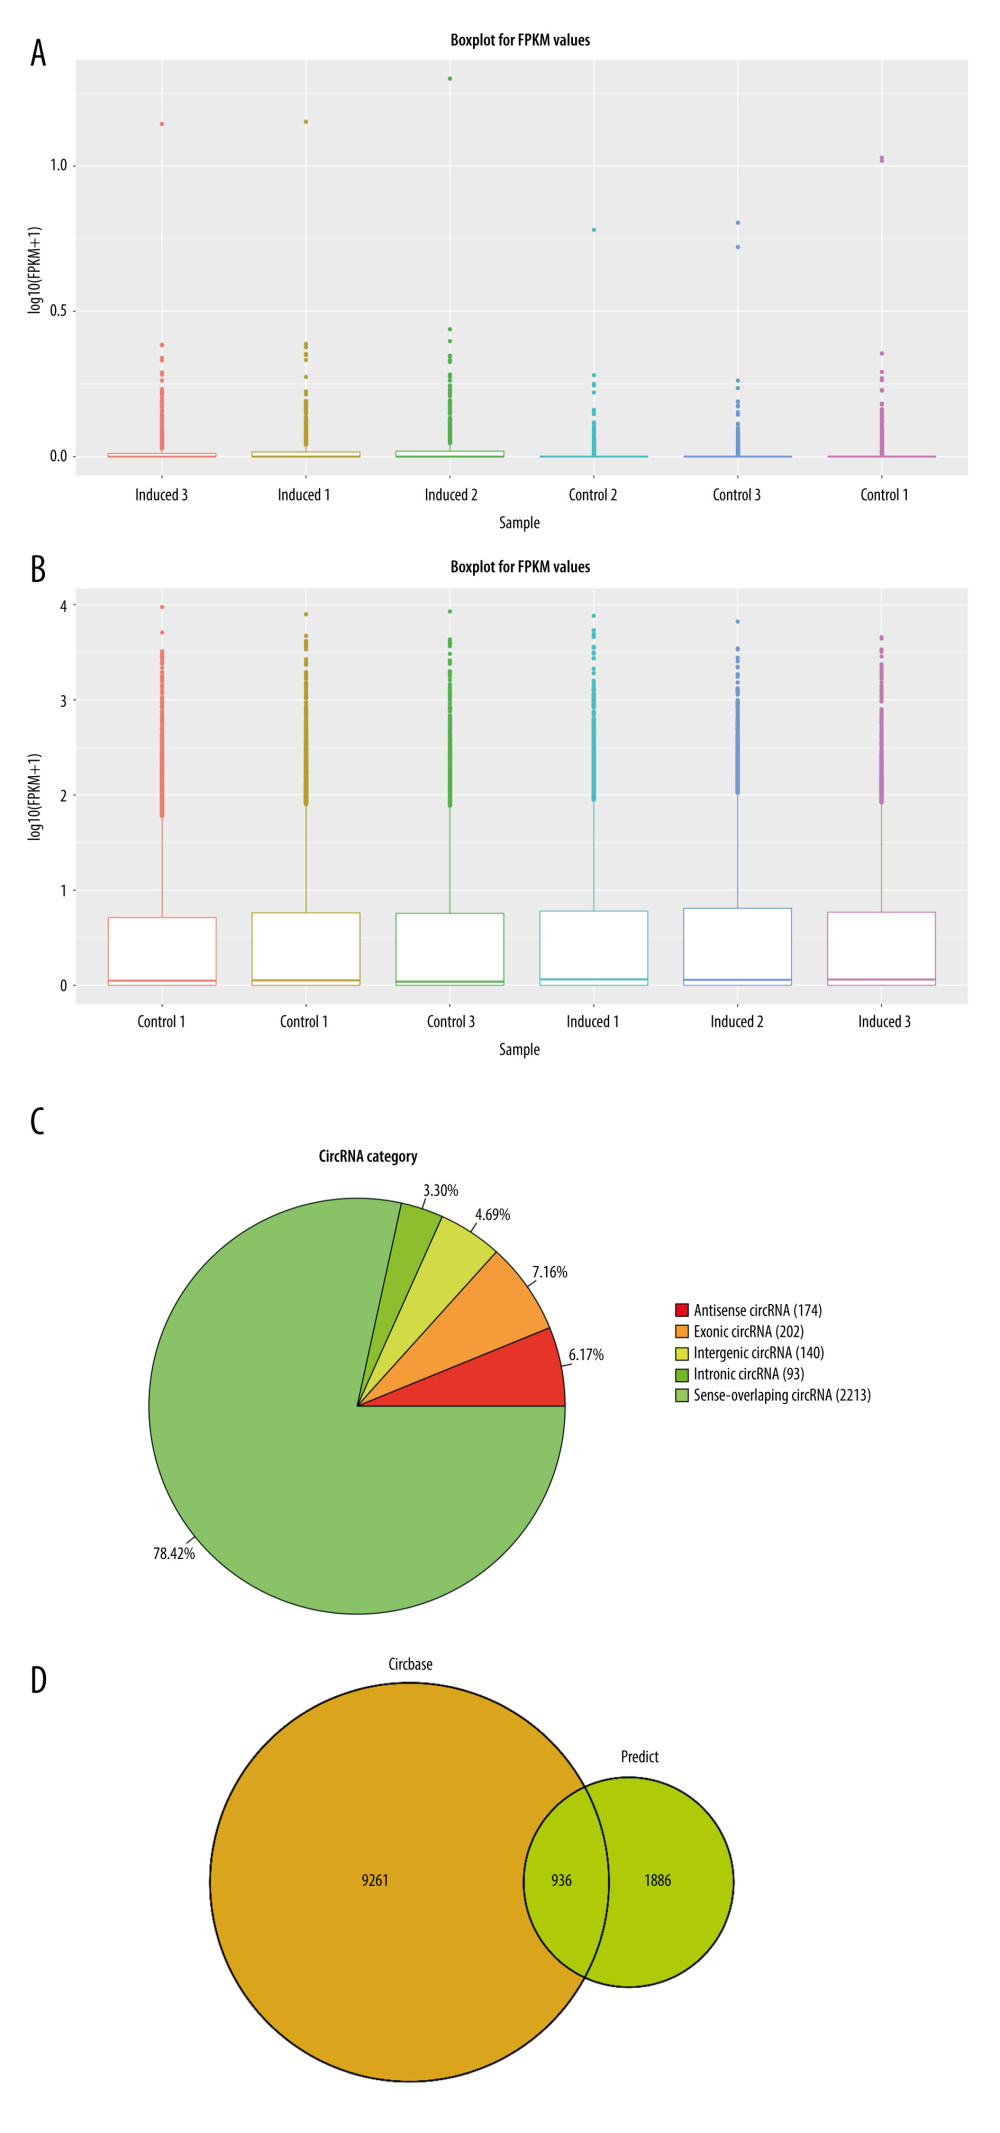
Figure 4 Statistics of sequencing results of circRNAs. (A) Box-whisker plot reflect the signal difference of circRNAs sequencing samples. (B) Box-whisker plot reflect the signal difference of mRNAs sequencing samples. (C) circRNAs gene structure distribution map. (D) The circRNAs identified compared with circRNAs in the known database. (A, C) The heat maps were constructed based on expression values of circRNAs and mRNAs detected by RNA-seq, respectively. The expression values from -2 to 2 were depicted in line with the color scale representing the intensity increased from green to red. Three osteogenic induced groups and 3 control groups were included, and each group included 3 samples. Each column represented 1 sample and each row indicated 1 transcript. (B, D) Filtered transcripts were in gray, transcripts with nonsignificant differences were in blue, and transcripts with significant differences were in red. The log 2 foldchange was displayed on the horizontal axis, and −log 10 (P value) was displayed on the vertical axis.