10 October 2022 : Database Analysis
Porphyromonas gingivalis Activation of Tumor-Associated Macrophages via DOK3 Promotes Recurrence of Oral Squamous Cell Carcinoma
Chen-xi Li123ABCDEF*, Ying Su4ABCD, Zhong-cheng Gong123ACDG, Hui Liu56ACDDOI: 10.12659/MSM.937126
Med Sci Monit 2022; 28:e937126


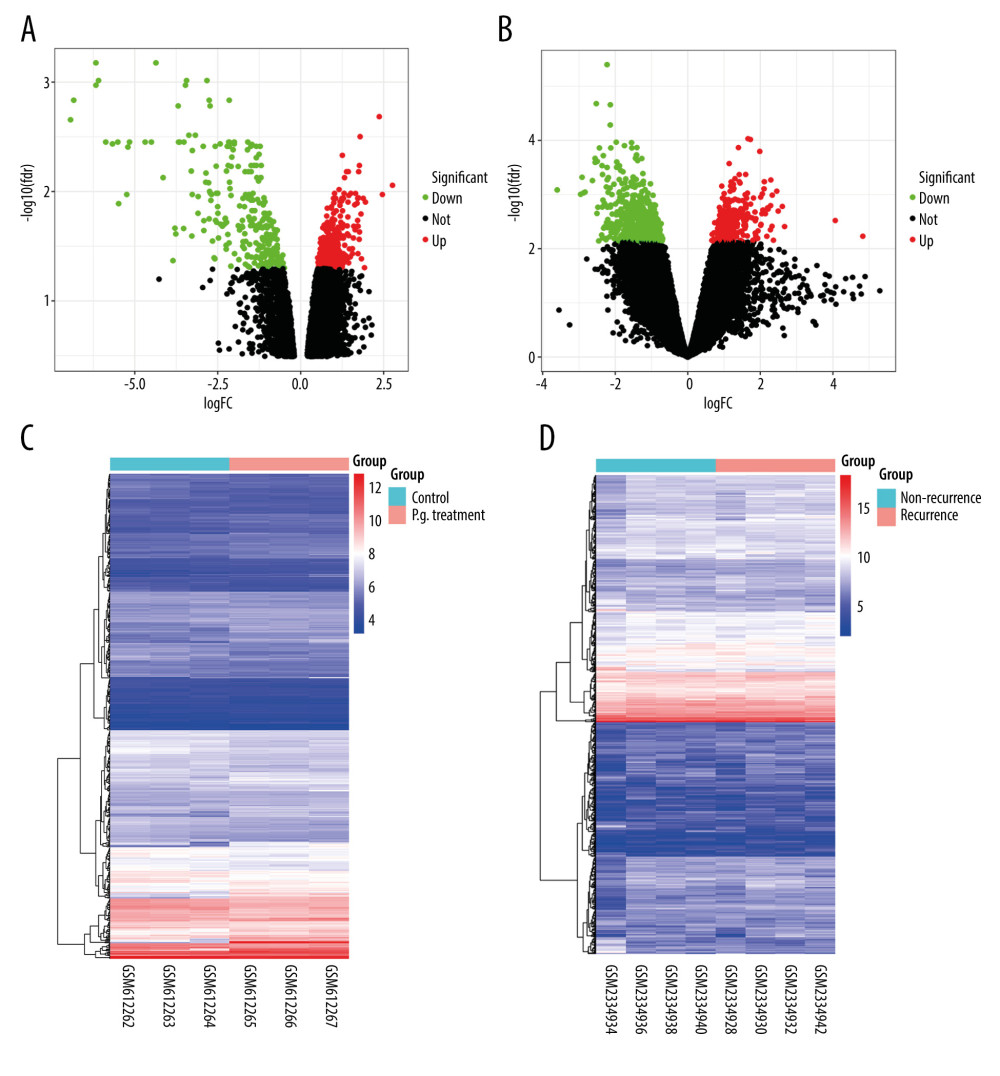
Figure 1 Distributions of differentially-expressed genes.(A, B) The volcano plot of GSE24897 and GSE85793. Green dots represent significantly downregulated genes, red dots represent significantly upregulated genes, and black dots represent insignificantly changed genes. (C, D) The heatmaps of DEGs. Blue color represents low expression genes, red color represents high expression genes, and different color brightness represents gene expression. R software 4.1.3 version was used for visualization.