25 April 2023 : Database Analysis
Evolution of Inguinal Hernia Publications: A Bibliometric Analysis from 1980 to 2021
İbrahim Tayfun ŞahinerDOI: 10.12659/MSM.939613
Med Sci Monit 2023; 29:e939613


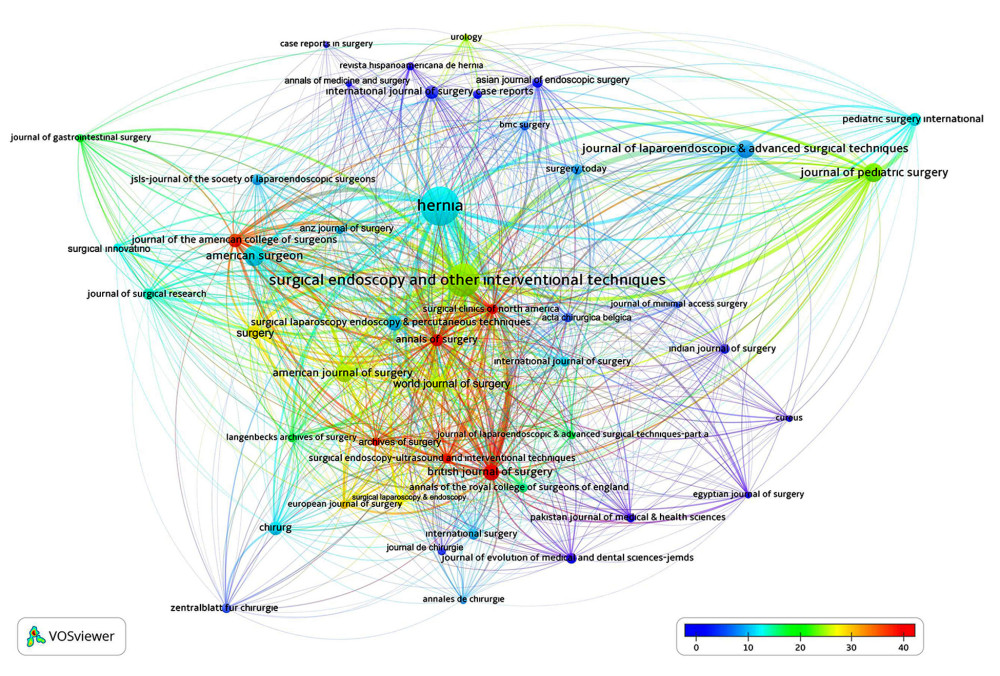
Figure 4 Network visualization map for analysis of citations per article of active journals that publish the most articles on inguinal hernia. The size of the circle indicates the large number of articles. The average number of citations per article by journals increases from blue to red (blue-green-yellow-red). Created by VOSviewer (version 1.6.16, Leiden University’s Center for Science and Technology Studies).