13 June 2023 : Clinical Research
Comparison of Texture and Color Enhancement Imaging with White Light Imaging in 52 Patients with Short-Segment Barrett’s Esophagus
Atsushi Ikeda1BCDEF, Tsutomu TakedaDOI: 10.12659/MSM.940249
Med Sci Monit 2023; 29:e940249


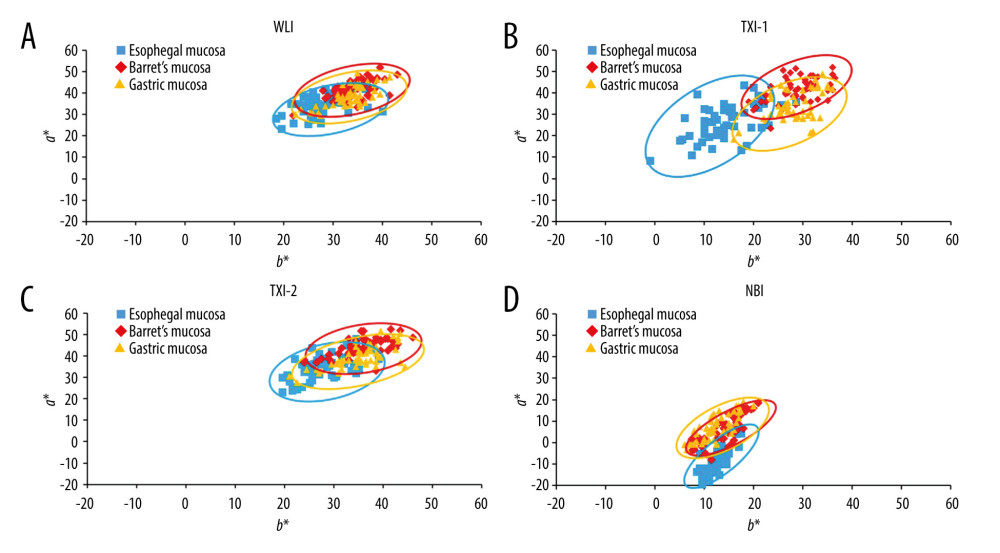
Figure 4 Scatter plot of a*b* color values in the Commission Internationale de l’Eclairage (CIE) L* a* b* color-space system. The blue squares enclosed by blue ellipses represent esophageal mucosa. The red rhombuses enclosed by red ellipses represent Barrett’s esophagus. The orange triangles enclosed by orange ellipses represent gastric mucosa. (A) White light imaging (WLI). There is some overlap between each site. (B) Texture and color enhancement imaging mode 1 (TXI-1). Good color separation and less overlap between each site are apparent compared with WLI, texture and color enhancement imaging mode 2 (TXI-2), and narrow-band imaging (NBI). (C) TXI-2. Some overlap is apparent between each site. (D) Narrow-band imaging (NBI). Some overlap is apparent between each site.