26 January 2024 : Laboratory Research
CTRP13 Mitigates Endothelial Cell Ferroptosis via the AMPK/KLF4 Pathway: Implications for Atherosclerosis Protection
Jie Du123ABCDEF, Jianjun Wu12ABC, Youqi Zhang12CDF, Qi Liu12CDF, Xing Luo12ABD, Xingtao Huang12ABC, Xuedong Wang12ABC, Fan Yang12AEF, JingBo Hou12ABCDEFG*DOI: 10.12659/MSM.942733
Med Sci Monit 2024; 30:e942733


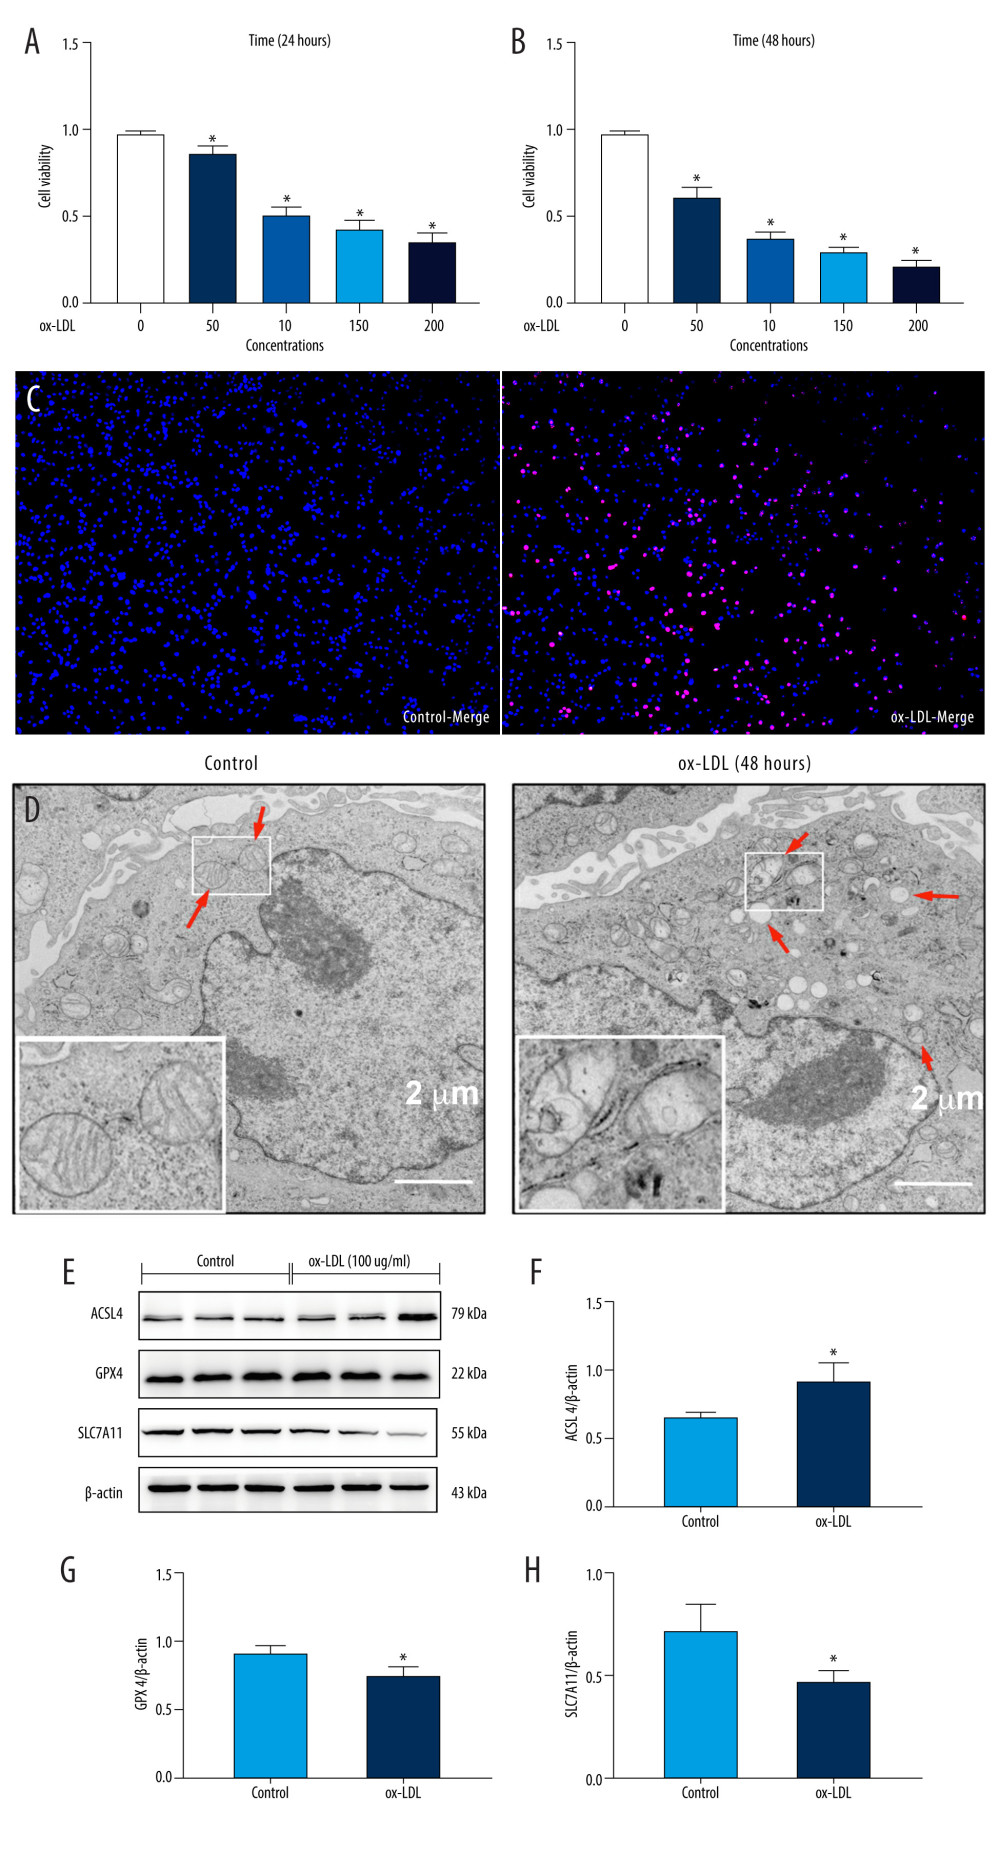
Figure 1 Oxidized low-density lipoprotein (ox-LDL) induced human umbilical vein endothelial cell (HUVEC) ferroptosis in a dose-dependent manner. (A, B) HUVEC metabolic activity was analyzed using Cell Counting Kit-8 (CCK-8) assay following treatment with ox-LDL (0–200 μg/mL; n=4). Statistical power=0.929356, effect size(r)=0.830181. (C) Hoechst/propidium iodide (PI) staining images were captured using fluorescence microscopy (Hoechst in blue, and PI in red; scale bars=100 μm). (D) The microscopic morphology of HUVECs under transmission electron microscope. (E) acyl-CoA synthetase long-chain family member 4 (ACSL4), glutathione peroxidase 4 (GPX4), and recombinant solute carrier family 7, member 11 (SLC7A11) protein expression levels were measured using Western blot analysis. (F–H) The results were normalized to controls, and histograms represent the relative intensities of ACSL4, GPX4, and SLC7A11. The data are expressed as the mean±SD (n=3–4 per group). Statistical power=0.913357, effect size(r)=0.804728. * P<0.05 vs the control group. # P<0.05 vs the ox-LDL group. Fluorescent images were evaluated using Olympus fluorescence microscopy with cellSens Dimension software (Version 1.3 rev, Olympus, Tokyo, Japan), and the positive cells was measured by Image Pro Plus 6.0 (Media Cybernetics, Rockville, MD, USA). Transmission electron microscopy (Talos L120C G2, FEI, Czech) was adopted to observe the morphology of HUVECs. The relative protein levels were quantified by Image J software (NIH, Bethesda, MD, USA). GraphPad Prism 9.0 software (La Jolla, USA) was used to analyze the data.