09 March 2024 : Database Analysis
Bibliometric Insights Into the Evolution of Atrial Fibrillation and Dementia Research 2002-2022
Yu Zhao1ABCDEF, Dianbo Wang1AF*DOI: 10.12659/MSM.943239
Med Sci Monit 2024; 30:e943239


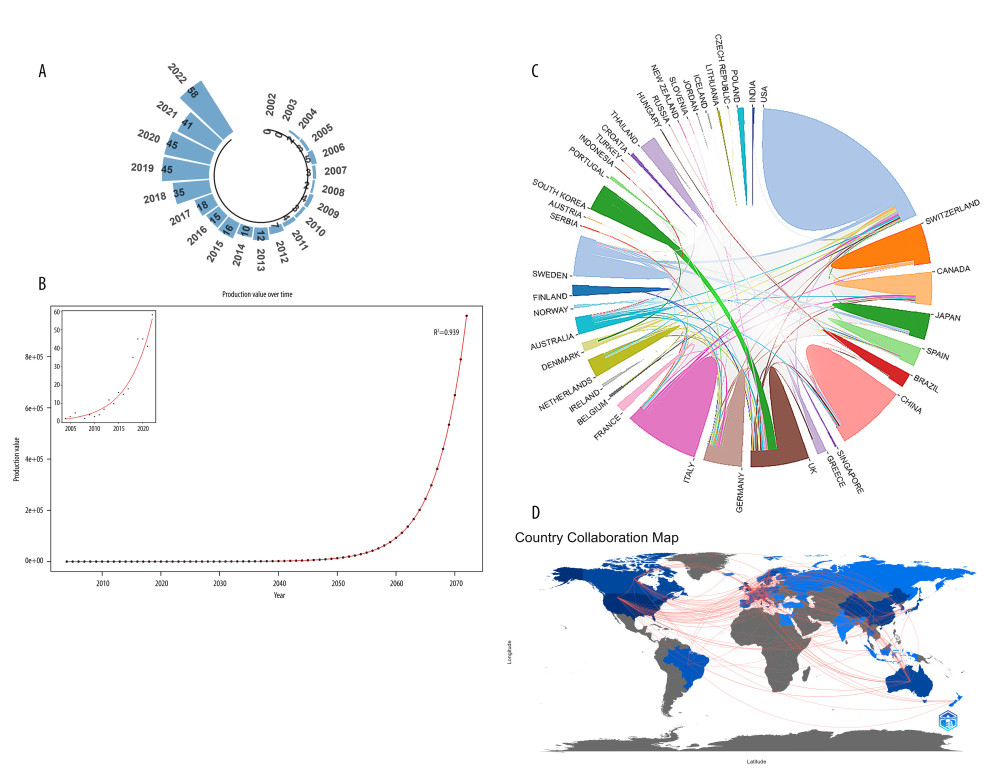
Figure 2 (A) The circular bar chart presents the annual publication count from 2002 to 2022. (B) The trend and fitted curve of the annual publication volume are presented, with R2 representing the coefficient of the model. A higher value of R2 indicates a better fitting effect of the equation. (C) The collaborative network among countries and regions is depicted, where the thickness of the lines denotes the level of collaboration intensity. (D). The geographic visualization map depicts participating countries, with lines symbolizing collaborations between countries and regions, and darker colors indicating higher publication volumes. Figure A was generated using the R (version 4.2.2) package “ggplot2.” Figure C was constructed using an online analysis platform available at http://bibliometric.com/. Figure D was created using the R (version 4.2.2) package “bibliometrix”.