09 March 2024 : Database Analysis
Bibliometric Insights Into the Evolution of Atrial Fibrillation and Dementia Research 2002-2022
Yu Zhao1ABCDEF, Dianbo Wang1AF*DOI: 10.12659/MSM.943239
Med Sci Monit 2024; 30:e943239


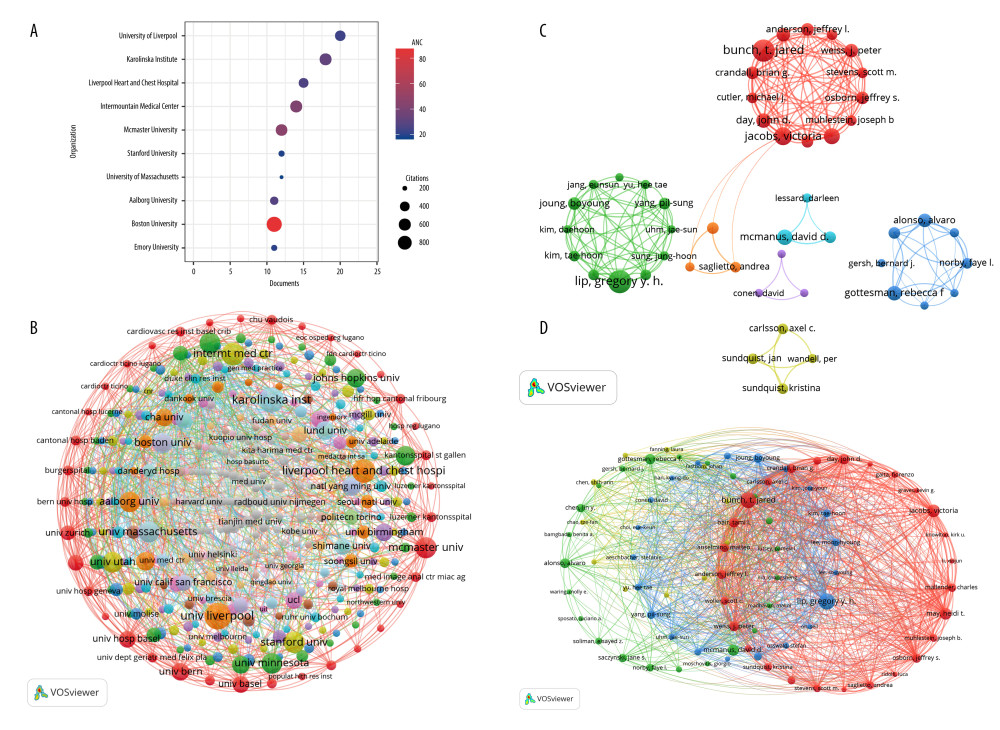
Figure 3 (A) The bubble chart depicts the quantity of publications, citations, and average citations generated by various institutions. (B) Institutional collaboration network. (C) Visualization of Author Collaboration Network Analysis. (D) The analysis of the collaborative network visualization of authors’ citations reveals distinct clusters, with different colors representing each cluster. The size of the nodes corresponds to the frequency of occurrence. Figure A was generated using the R (version 4.2.2) package “ggplot2”. Figures B, C, and D were produced utilizing VOSviewer software (version 1.6.17).