09 March 2024 : Database Analysis
Bibliometric Insights Into the Evolution of Atrial Fibrillation and Dementia Research 2002-2022
Yu Zhao1ABCDEF, Dianbo Wang1AF*DOI: 10.12659/MSM.943239
Med Sci Monit 2024; 30:e943239


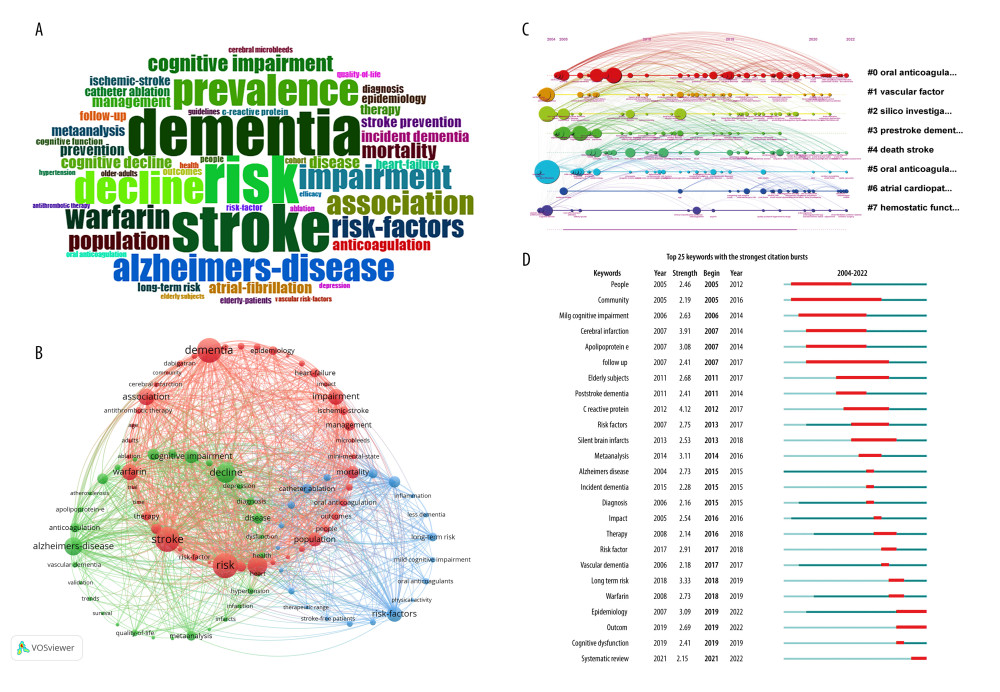
Figure 7 (A) Loud graph of high-frequency keywords. (B) Keyword visualization network. The nodes in different colors represent the different clusters, and the size of the nodes indicates the frequency of their occurrence. (C) Timeline view of keywords. The different colored horizontal lines with the label on the right represent the clusters formed by the keywords, the nodes on the horizontal lines represent the keywords, and the position of the nodes on the horizontal lines represents the year in which the literature containing the keywords first appeared, thus forming the timeline of the keywords cluster evolution. (D) The top 25 keywords with the strongest citation bursts. Figure A was created using the “bibliometrix” package in R (version 4.2.2), Figures B and C were constructed using VOSviewer software (version 1.6.17), and Figure D was generated using CiteSpace software (version 6.2. R3).