06 June 2023: Database Analysis
Enhancing Renal Tumor Detection: Leveraging Artificial Neural Networks in Computed Tomography Analysis
Mateusz GlembinDOI: 10.12659/MSM.939462
Med Sci Monit 2023; 29:e939462


Abstract
BACKGROUND: Renal cell carcinoma is one of the most common cancers in Europe, with a total incidence rate of 18.4 cases per 100 000 population. There is currently significant overdiagnosis (11% to 30.9%) at times of planned surgery based on radiological studies. The purpose of this study was to create an artificial neural network (ANN) solution based on computed tomography (CT) images as an additional tool to improve the differentiation of malignant and benign renal tumors and to aid active surveillance.
MATERIAL AND METHODS: A retrospective study based on CT images was conducted. Axial CT images of 357 renal tumor cases were collected. There were 265 (74.2%) cases histologically proven to be malignant, while 34 (9.5%) cases were benign. Radiologists diagnosed 58 (16.3%) cases as angiomyolipoma (AML), based on characteristic appearance, not confirmed histopathologically. For ANN training, the arterial CT phase images were used. A total of 7207 arterial-phase images were collected, then cropped and added to the database with the associated diagnosis. For the test dataset (ANN validation), 38 cases (10 benign, 28 malignant) were chosen by subgroup randomization to correspond to statistical tumor type distribution. The VGG-16 ANN architecture was used in this study.
RESULTS: Trained ANN correctly classified 23 out of 28 malignant tumors and 8 out of 10 benign tumors. Accuracy was 81.6% (95% confidence interval, 65.7-92.3%), sensitivity was 82.1% (63.1-93.9%), specificity was 80.0% (44.4-97.5%), and F1 score was 86.8% (74.7-94.5%).
CONCLUSIONS: The created ANN achieved promising accuracy in differentiating benign vs malignant renal tumors.
Keywords: Kidney Neoplasms, Neural Networks, Computer, Observation, Overdiagnosis, Tomography, X-Ray Computed, Humans, Retrospective Studies, Carcinoma, Renal Cell, Radiopharmaceuticals
Background
Renal cell carcinoma (RCC) represents 3.5% of all cancers in Europe, with a total estimated incidence rate of 18.4 cases per 100 000 population. It is the sixth most common cancer in men and the eleventh in women. In 2020 there were an estimated 138 600 new RCC cases in Europe [1]. Sixty-seven percent of cases are incidentally detected, with a median radiologic size of 44 mm [2]. The most commonly used modality in patients with renal tumors remains computed tomography (CT) with the assessment of contrast enhancement measured in Hounsfield units (HU). Most authors point to the threshold enhancement value of 20 HU for expected malignancy. Additional indicators of suspected malignancy are the presence of calcification, septa, or thick walls [3]. Basing the surgery only on radiologic diagnosis leads to an important degree of overdiagnosis, as the reported percentage of benign renal masses after renal tumor surgery varies from 11% to 30.9% [4,5].
Combining 138 600 new RCC cases in Europe per year with an approximate 20% benign rate suggests that an estimated 27 720 cases of partial or total nephrectomies are performed yearly, without any other reason than suspected malignancy in the great majority. The surgical procedures, especially radical nephrectomy, are combined with the drop in nephron numbers and the decrease in the estimated glomerular filtration rate (eGFR). The risk of end-stage renal disease (ESRD) in patients with normal eGFR within 10 years after renal surgery is 2% [6]. The perioperative risk of serious complications (Clavien-Dindo grade 3–5 [7]) after partial and total nephrectomy is 6% and 3.5% respectively, with the calculated mean value of 4.7% for both surgery types [8]. Summarizing the available data on overdiagnosis and overtreatment of potential RCC in Europe leads to an estimated 554 new ESRD cases and 1303 high-grade perioperative complications in patients without malignant kidney tumors annually.
Current alternatives to surgery for potentially benign renal masses are observation and renal mass biopsy (RMB). The main advantage of RMB is obtaining histology without surgery with high accuracy (87% for renal masses less than or equal to 4 cm) [9]. The main limitations of RMB are its high non-diagnostic rate (13–14.6%), low negative predictive value (63.3%), and the risk of complications (1.5–8.1%) [9–11]. It should be noted that most patients receiving a benign diagnosis after biopsy did not undergo surgery. Selection bias was likely a significant contributor to the low negative predictive value. Patients who underwent the surgery despite benign biopsies may have been chosen based on factors such as lesion growth and thus may not represent the entire population of patients with a benign diagnosis. For renal tumors with clinical stage T1a, according to TNM 8th edition (equal to or less than 4 cm, small renal masses [SRMs]), active surveillance (AS) is emerging as a viable alternative to surgery [12]. SRMs have a very good prognosis, as it is documented that they grow at an average rate of 0.12–0.44 cm per year [13–15] and surgical results for small tumors are excellent [16]. A new AS protocol for renal masses was proposed in 2020 by Sebastia et al [12], which focuses mainly on repeating CT scans, made every 3–6 months for 2–3 years, and then repeated every year. Additional non-invasive tools could aid diagnosis and reduce the frequency of CT performed in AS. Adding ANN diagnosis could decrease the frequency of imaging needed in AS. Further investigation is required to obtain an additional method for diagnosis of non-invasive SRMs.
The purpose of this study was to create a new additional diagnostic tool based on CT images and artificial neural networks (ANN), based on a larger number of cases than described before, and to achieve sensitivity and accuracy of at least 80%, proving that ANN-based diagnosis could in the future improve differentiation and aid observation in selected cases of SRMs suspected of being benign.
Material and Methods
ETHICS STATEMENT:
In this retrospective study, all data were provided in anonymized form by the hospital from their database and were analyzed in aggregated form using statistical methods. The local Medical Chamber stated that consent of the Bioethics Committee was not deemed necessary for retrospective studies based on anonymized data.
DATA COLLECTION:
This retrospective study was based on anonymized CT images, obtained from St. Adalbert Hospital in Gdańsk (SAH), which is part of COPERNICUS Healthcare Entity, Ltd.
The data were collected from 2 sources: the picture archiving and communication system (PACS) from SAH, and the generally available 2019 Kidney and Kidney Tumor Segmentation Challenge (KITS19) dataset [17]. For research purposes, axial cross-section CT images containing renal tumors were collected in the Digital Imaging and Communications in Medicine (DICOM) format. All phases of the CT study were collected when available (non-enhanced, arterial, venous, delayed). The best results were achieved using the arterial phase CT images and thus they were used for final ANN training. Arterial-phase images were also preferred by other researchers, such as Tanaka et al [18], and achieved the best results for corticomedullary phase.
The first round of data was obtained from SAH PACS. We only included PACS-available CT scans, from years 2016–2019, containing renal tumors from patients who had surgery in SAH performed from suspected malignancy (partial and total nephrectomies) with concomitant histopathology diagnosis available. There were 103 cases, with concomitant 1579 DICOM arterial-phase images.
The second round of data was collected from KITS19. The KITS19 dataset was created for renal segmentation based on CT images and ANNs, and every case included a histopathological diagnosis (196 cases, 5470 DICOM arterial-phase images).
Finally, taking into consideration a small number of benign tumors in the dataset, additional cases were added from the PACS containing angiomyolipomas (AMLs). Those cases were diagnosed by radiologists based on characteristic appearance, without histopathological confirmation (58 cases, 158 DICOM images). All additional CT renal tumor cases diagnosed as AML in the radiological description performed in 2019 were included. The total number of AMLs in our study was 68 cases; 10 were diagnosed histopathologically and 58 were diagnosed only by radiologists.
We focused on available 2.5-mm slice-thickness images because they seem to provide the best balance of image quality and number of DICOM images. When they were not available, we collected other slice-thickness images (from 1.5 to 5 mm). Only 1 series (mainly 2.5-mm) from each arterial-phase CT scan was added per case. The collected images were cropped to 130×130 pixels, with corresponding metadata saved into the database (1 series of arterial-phase slices for every case). We only collected and used CT images of the axial plane, which are always available as a standard reference plane.
EXCLUSION CRITERIA:
DICOM images containing significant renal pathologies other than a single solid renal mass (eg, urolithiasis, cysts, 2 renal tumors in the same axial CT image), and far-edge axial scans of the tumors were excluded as non-viable for diagnostics (exclusion criteria). We exclude those slices to prevent misleading the ANN from searching for other pathologies instead of tumors. The rest of the DICOM images from the same case were included when possible.
COLLECTED DATA SUMMARY:
A total of 357 renal tumor cases were collected. The number of acquired arterial phase DICOM files was 7207 (Table 1). The average age of patients was 60±13 years. Men and women accounted for 163 (45.7%) and 194 (54.3%) cases, respectively.
DATA PROCESSING:
For every DICOM file included in the study, the image was cropped by a urologist to a region of interest (ROI), centering the ROI on the kidney with a renal tumor. Cropped 130×130 pixel images containing raw data from the Pixel Data tags of the DICOM files with the corresponding additional information like study phase, tumor diagnosis, maximum axial-scan tumor size, gender, and patient age were sent to the database. The selection of ROI in the dataset was confirmed by the second reader to minimize user-dependent bias.
ANN INTRODUCTION:
Our approach was based on ANN with particular emphasis on using convolutional neural networks (CNNs). ANNs are a type of mathematical model where weights are dynamically assigned to different features using a backpropagation algorithm based on stochastic gradient descent and its derivatives. This approach, being a type of supervised learning, can be intuitively understood in the following fashion: each example in the training dataset acts as a direction for the model to adjust its parameters in certain ways to improve its accuracy and generalization capabilities. The model’s performance is then evaluated on a test dataset, consisting of examples it has not seen before, to test its generalization capabilities. CNNs are a subtype of ANNs that are designed specifically to work with image data. Instead of standard weights, they learn what filters are to be applied to the images to extract their important features. Those filters (kernels) are analogous to those used in image processing, where one can, for example, detect edges in the image by applying certain filters. The major difference between CNNs and standard image processing techniques is the fact that those filters are not designed by humans but rather are learned automatically. In the image classification problem, common practice is to extract important features from the image using CNNs, then use those features as an input to the standard, fully-connected ANN that performs the classifications.
TEST DATASET:
The test dataset (ANN validation) was randomized from tumor subgroups to correspond with the statistics of the entire created dataset (Table 1). The test dataset was approved by the independent committee of urologists working in the SAH. For ANN-testing purposes, only renal tumor axial scans with a maximal diameter of renal tumor were used (mostly middle cross-section). Test dataset images were taken from the main dataset and were previously collected in the same way as all images (during the collecting phase). All test cases were excluded from the main dataset (all slices of chosen cases). The test dataset was created before ANN training to protect against bias. Statistics of the test dataset are shown in Table 1. For ANN-learning, all arterial-phase images collected from patients were used, excluding all cases with corresponding DICOM images (all slices) from the ANN testing dataset. Based on the preliminary results of accuracy and sensitivity (pre-trained ANNs), the best results were achieved using the arterial-phase CT images, and consequently they were used for final ANN training. Usage of all phases of CT scans was considered, but we decided to use them in the future, together with a larger database.
ANN ARCHITECTURE:
We decided to use the ANN VGG-16 architecture, which has been widely used in the medical field [19,20], and has proven to achieve better performance than with other pre-trained architectures on the ImageNet dataset. Despite ImageNet being a non-medical dataset, it has been proven to be an effective way to approach transfer learning in medical tasks. Additionally, within preliminary experiments based on our dataset, the VGG-16 ANN achieved a very favorable ratio of classification effectiveness to training duration. The VGG-16 network was followed by the classification section of the ANN, as shown in Figure 1. ANN plays the key role in this part of the 2 fully connected layers, with a size of 4096 neurons per layer. To avoid overfitting the model, we applied 0.4 and 0.3 dropout layers. To stabilize the learning process and reduce the number of training epochs, we also used the batch normalization layer. The model was trained for 30 epochs using an Adam optimizer with a learning rate of 0.0001. A data augmentation system was created that allows creation of new images that enlarge the training dataset through various types of operations and transformations (rotation by an angle, horizontal reflection, vertical reflection, change of brightness and contrast, and Gaussian blurring) performed on original images. All these transformations were performed on the arrays containing raw data saved in the Pixel Data tags of the DICOM files.
In our approach, we assigned the image to the histopathological subtype of the tumor and trained the network to predict this subtype, then we performed max-pooling to determine the final probability of the tumor as malignant or benign; the probability of the tumor being benign is denoted as the probability of the most probable benign histopathological subtype, and the probability of the tumor being malignant is denoted as the probability of the most probable malignant histopathological subtype. The architecture of the network is presented in Figure 1. Although the network achieved suboptimal results in predicting the detailed histopathological subtype, it increased the final accuracy of the binary classification.
STATISTICAL ANALYSIS:
For the evaluation of the proposed ANN model, we chose the following metrics: sensitivity (proportion of malignant tumors that were correctly identified as malignant), specificity (proportion of benign tumors that were correctly identified as benign), precision (depicting how often the ANN was correctly labeling a tumor as malignant), and F1 score (harmonic mean of precision and sensitivity), which informs about the ANN’s balanced ability to both identify malignant tumors (sensitivity) and be accurate with the tumors it does capture (precision). The primary goal of our proposed classification model was to detect tumors that were mislabeled as malignant in the radiological diagnosis but are actually benign. Therefore, we believe the most important metric is specificity. The 95% confidence intervals (CI) for the above metrics of the classification model were calculated within the Clopper-Pearson approach [21].
Results
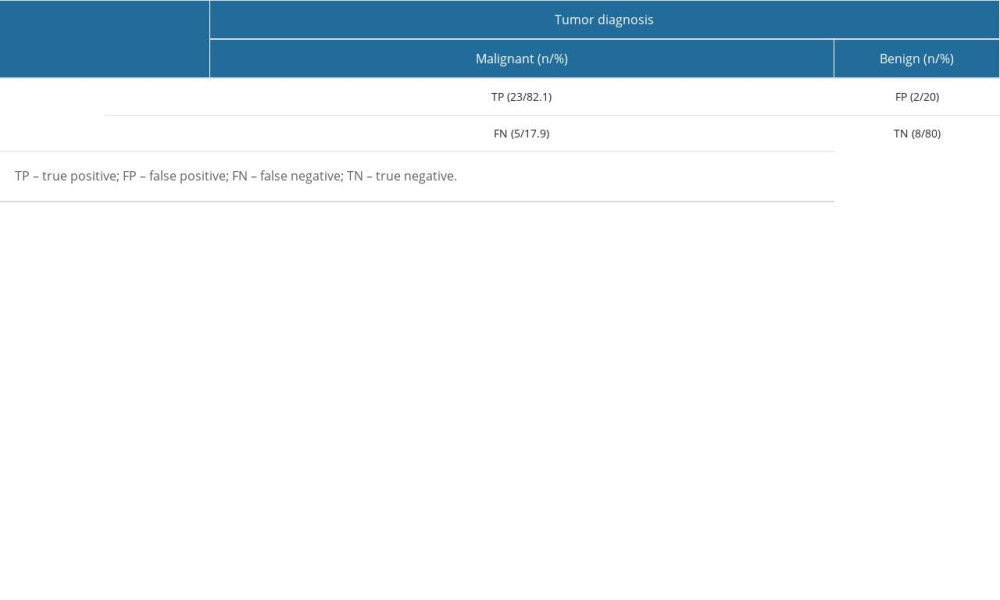
The ANN we created correctly classified malignant tumors in 23 out of 28 and benign tumors in 8 out of 10 test cases. The malignancy and benignity prediction results for every tumor in the test dataset are presented in Figure 2. The misclassifications are shown in the red borders. The total accuracy of the presented approach was 81.8%, with the 95% CI ranging from 65.7% to 92.3%. In turn, the sensitivity, specificity, and precision were equal to 82.1%, 80.0%, and 92% respectively. The 95% CIs for these metrics are 63.1–93.9%, 44.4–97.5%, and 74.0–99.0%, respectively. It is important to emphasize that the F1 score is 86.8% with a 95% CI in the range of 74.7–94.5%, which means that the presented model achieved a satisfactory balance between precision and sensitivity. Also, for binary classification, sensitivity represents the statistical power [22] of the study; thus, it is found to be 0.821. This indicates that the sample size was large enough for the training process. The confusion matrix is shown in Table 2.
The ANN was trained on tumors of different sizes, from 4 to 162 mm (Figure 3), with the mean and standard deviation (SD) values of 39.2 and 28.9 mm, respectively. In the dataset, SRMs accounted for 62.2% of cases (222 out of 357 total cases). Considering that the proposed solution could be the most useful for the diagnosis of SRMs, the model achieved even better results for SRMs than in the general case. So, taking into account only SRMs in our test dataset (27 out of 38 cases: 10 benign, 17 malignant), the ANN correctly classified 80.0% of benign and 88.2% of malignant tumors, with an overall accuracy of 85.2%.
Discussion
ANN diagnosis achieves growing acceptance in the field of radiology [23]. Taking into account the aging population and the growing number of cancer patients, the future role of ANNs in cancer diagnosis seems inevitable [1]. There are multitudes of potential uses of ANN in radiology described in the literature. Currently, ANNs are used for patient scheduling, clinical decision support, image acquisition, automated detection and interpretation of image features, and image postprocessing [24]. Deep learning algorithms can make cancer diagnosis potentially more accurate than humans, as demonstrated by Haenssle et al [25] in a study comparing results of dermatologists vs trained CNN in melanoma diagnosis. High accuracy is especially important in groups of tumors that seem to be radiologically and macroscopically indistinguishable, making differentiation without pathological examination nearly impossible.
All studies conducted on this topic so far were performed on a small number of cases (less than 200), which could have induced significant bias. There were several studies on RCC diagnosis based on ANN and CT.
In 2020, Tanaka et al [18] achieved 88% accuracy in differentiating benign vs malignant renal tumors based on 168 only pathologically confirmed tumors (136 malignant and 32 benign). All tumors were smaller than 4 cm. They managed to gather a database in which there were no significant differences in size between benign and malignant tumors. The main limitation was the relatively small total number of cases in the database.
In 2019, Han et al [26] distinguished 3 major subtypes of RCC (clear cell, papillary, and chromophobe) using ANN. The total number of biopsy-proven cases was 169. Images were acquired in 3 CT phases (before contrast and at 1 and 5 minutes after contrast injection). All 3 images were combined into 1 as an input for the ANN (GoogLeNet architecture). They achieved a sensitivity of 0.64–0.98 and specificity of 0.83–0.93 in RCC subtyping, confirming that RCC subtyping is possible only with radiological CT images. The main limitations of the study were the low total number of cases and use of only a biopsy-based diagnosis, which is not as accurate as full pathological examination.
In 2018, Feng et al [27] focused on the differentiation of AMLs without visible fat from RCCs. The total number of cases was 58, out of which 17 were AMLs and 41 were RCCs. All cases were pathologically proven. Sensitivity and specificity were 87.8% and 100%, respectively. Although their results were promising, the dataset was too small to draw any significant conclusions, in contrast to our present dataset.
In 2017, Yu et al [28] differentiated between various types of RCCs and oncocytomas. All cases were pathologically proven. The total number of cases was 119. They achieved an area under the curve (AUC) of 0.81 for clear-cell RCC, 0.81 for papillary RCC, 0.76 for chromophobe RCC, and 0.92 for oncocytoma. The differentiation of oncocytomas from RCCs had satisfactory results (AUC for papillary RCC=0.99, AUC for other RCC subtypes=0.92).
In 2022, Zhu et al [29] showed that the use of 3D CT images could provide even better results for kidney and tumor segmentation. They achieved better results than those previously achieved for kidney and tumor segmentation (Dice values of 0.97 for kidney and 0.77 for tumor segmentation). Using pre-segmented CT images as ANN input could further improve results in the future.
We collected more than 350 cases; therefore, our results are more reliable than in previous studies. We achieved sufficient accuracy (81.8%) to prove that ANNs can be used in malignant vs benign tumor differentiation. Our results are promising for future use of ANNs in renal cancer diagnostics. However, they still seem far from the acceptance level for routine use in urology. A larger dataset may allow us to improve the results. Our solution could aid diagnosis and allow easier follow-up of small renal tumors on an outpatient basis, and could also contribute to reducing the need for CT studies.
Our main limitations were the number of AMLs not confirmed pathologically (16.3%) and the significant differences in median size of malignant vs benign tumors (Table 1), which might introduce a bias. We plan to collect more pathology-proven benign tumor cases to consequently exclude those cases in future analyses. Also, we plan to limit the maximum size of tumors to exclude very large tumors with sizes greater than 7 cm (see the tumor sizes distribution in Figure 3). The additional limitation of our study was the data cropping technique. Currently, data cropping from DICOM files is performed by humans. We plan to introduce an automated annotation service based on ANNs, allowing cropping ROI on CT images, to eliminate user-dependent results and further dataset expansion.
The average accuracy of ANNs in differentiating renal tumors is currently about 80–90% [18,26–28]. We have achieved similar performance. However, due to different ANN algorithms used, results cannot be directly compared. We believe that more cases are required to obtain higher accuracy, as needed for recommendations and routine use in radiology and urology. We plan to collect more cases in cooperation with other hospitals. We hope that the future version of our ANN-based algorithm will aid the decision process in cases of small, non-life-threatening tumors, especially centered-positioned tumors or in elderly patients.
Conclusions
We have proposed a new approach for renal tumor diagnosis based on deep learning techniques. Our algorithm uses a DICOM file containing the renal tumor in an arterial-phase middle-most axial scan and estimates the chances of the renal tumor being benign or malignant. The achieved accuracy, sensitivity, specificity, and F1 scores were 81.8%, 82.1%, 80%, and 86.8%, respectively. In the future, our solution could aid in SRM diagnosis and help many patients preserve their kidney function in case of benign disease.
Figures
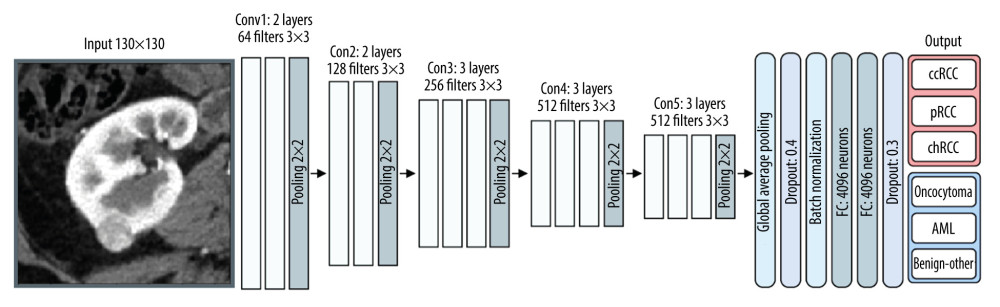 Figure 1. Structure of the used ANN. Gimp 2.10.32.
 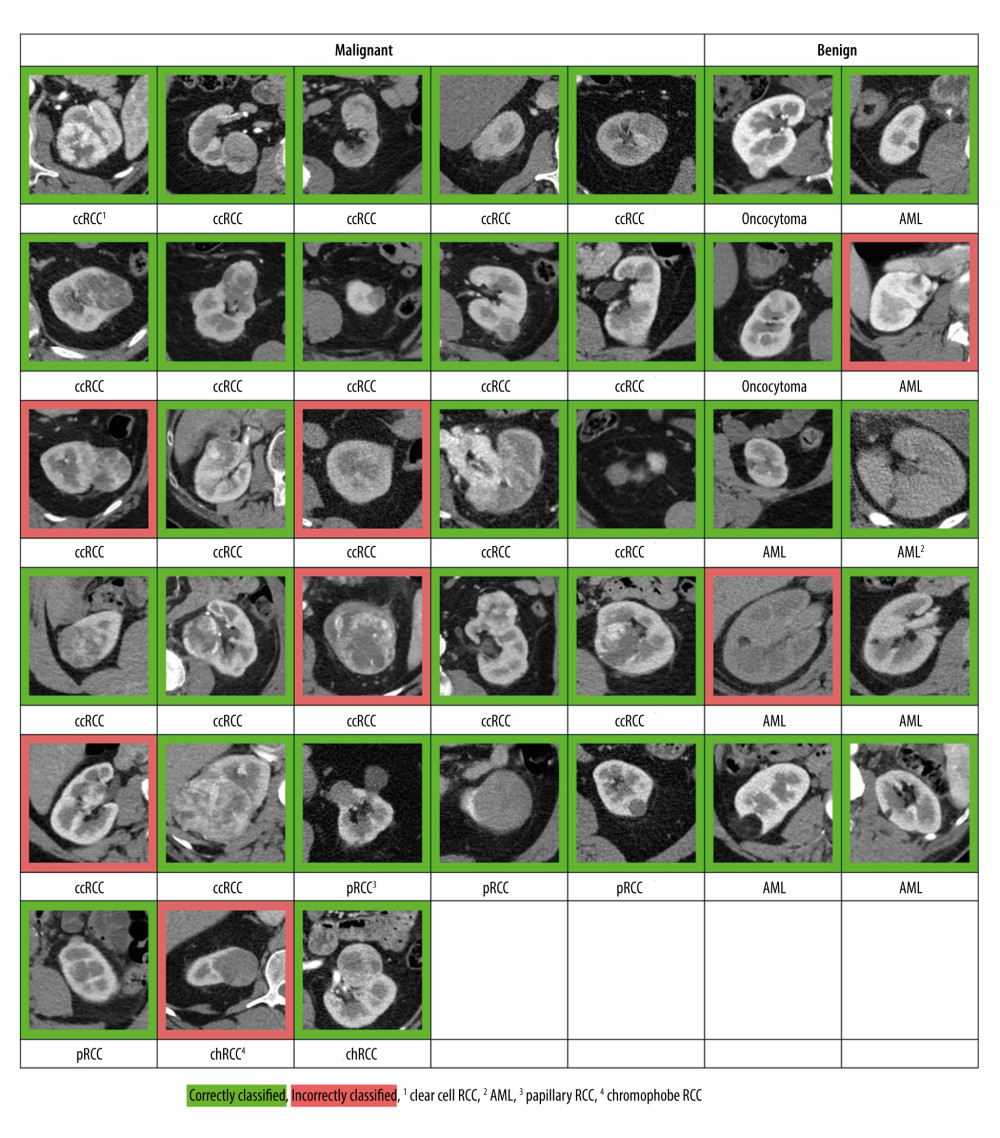 Figure 2. Malignant and benign tumors chosen for the test dataset (arterial phase). Raw image created in Google Sheets, TIFF version – Gimp 2.10.32.
 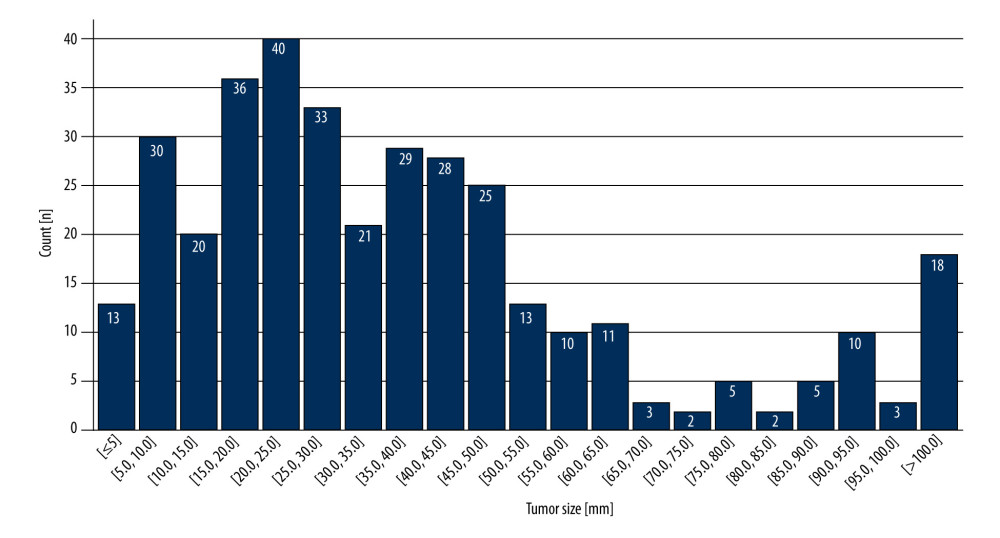 Figure 3. Tumor size distribution. Raw image created in Google Sheets, TIFF version – Gimp 2.10.3.
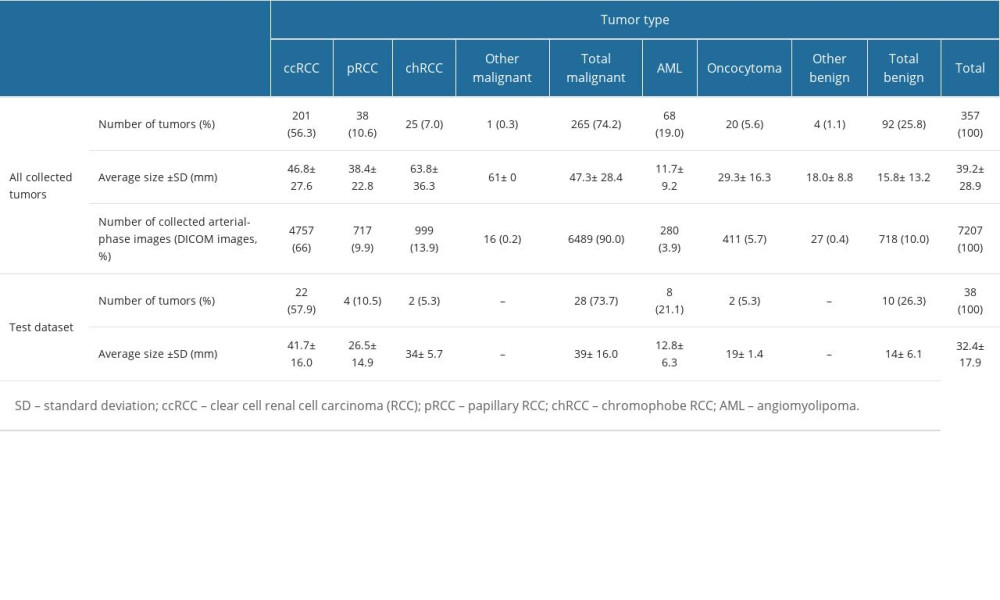
References
1. Ferlay J, Colombet M, Soerjomataram I, Cancer incidence and mortality patterns in Europe: Estimates for 40 countries and 25 major cancers in 2018: Eur J Cancer, 2018; 103; 356-87
2. Laguna MP, Algaba F, Cadeddu J, Current patterns of presentation and treatment of renal masses: A clinical research office of the endourological society prospective study: J Endourol, 2014; 28(7); 861-70
3. Israel GM, Bosniak MA, Pitfalls in renal mass evaluation and how to avoid them: Radiographics, 2008; 28(5); 1325-38
4. Richard PO, Lavallée LT, Pouliot F, Is routine renal tumor biopsy associated with lower rates of benign histology following nephrectomy for small renal masses?: J Urol, 2018; 200(4); 731-36
5. Kim JH, Li S, Khandwala Y, Chung KJ, Association of prevalence of benign pathologic findings after partial nephrectomy with preoperative imaging patterns in the United States from 2007 to 2014: JAMA Surg, 2019; 154(3); 225-31
6. Capitanio U, Larcher A, Terrone C, End-stage renal disease after renal surgery in patients with normal preoperative kidney function: Balancing surgical strategy and individual disorders at baseline: Eur Urol, 2016; 70(4); 558-61
7. Yoon PD, Chalasani V, Woo HH, Use of Clavien-Dindo classification in reporting and grading complications after urological surgical procedures: analysis of 2010 to 2012: J Urol, 2013; 190(4); 1271-74
8. Lowrance WT, Yee DS, Savage C, Complications after radical and partial nephrectomy as a function of age: J Urol, 2010; 183(5); 1725-30
9. Lobo JM, Clements MB, Bitner DP, Does renal mass biopsy influence multidisciplinary treatment recommendations?: Scand J Urol, 2020; 54(1); 27-32
10. Patel HD, Johnson MH, Pierorazio PM, Diagnostic accuracy and risks of biopsy in the diagnosis of a renal mass suspicious for localized renal cell carcinoma: Systematic review of the literature: J Urol, 2016; 195(5); 1340-47
11. Posielski NM, Bui A, Wells SA, Risk factors for complications and nondiagnostic results following 1,155 consecutive percutaneous core renal mass biopsies: J Urol, 2019; 201(6); 1080-87
12. Sebastià C, Corominas D, Musquera M, Active surveillance of small renal masses: Insights Imaging, 2020; 11(1); 63
13. Organ M, Jewett M, Basiuk J, Growth kinetics of small renal masses: A prospective analysis from the Renal Cell Carcinoma Consortium of Canada: Can Urol Assoc J, 2014; 8(1–2); 24-27
14. Gofrit ON, Yutkin V, Zorn KC, The growth rate of “clinically significant” renal cancer: Springerplus, 2015; 4; 580
15. Mehrazin R, Smaldone MC, Kutikov A, Growth kinetics and short-term outcomes of cT1b and cT2 renal masses under active surveillance: J Urol, 2014; 192(3); 659-64
16. Scoll BJ, Wong YN, Egleston BL, Age, tumor size and relative survival of patients with localized renal cell carcinoma: A surveillance, epidemiology and end results analysis: J Urol, 2009; 181(2); 506-11
17. Heller N, Isensee F, Maier-Hein KH, The state of the art in kidney and kidney tumor segmentation in contrast-enhanced CT imaging: Results of the KiTS19 challenge: Med Image Anal, 2021; 67; 101821
18. Tanaka T, Huang Y, Marukawa Y, Differentiation of small (£4 cm) renal masses on multiphase contrast-enhanced CT by deep learning [published correction appears in Am J Roentgenol. 2020;214(4):945]: Am J Roentgenol, 2020; 214(3); 605-12
19. Guan Q, Wang Y, Ping B, Deep convolutional neural network VGG-16 model for differential diagnosing of papillary thyroid carcinomas in cytological images: A pilot study: J Cancer, 2019; 10(20); 4876-82
20. Sitaula C, Hossain MB, Attention-based VGG-16 model for COVID-19 chest X-ray image classification: Appl Intell (Dordr), 2020; 51(5); 2850-63
21. Brown LD, Cai TT, DasGupta A, Interval estimation for a Binomial Proportion: Statistical Scicienc, 2001; 16(2); 101-33
22. Riffenburgh RH, Gillen D: Statistics in medicine, 2020, Academic Press
23. Wang S, Zhou L, Li X, A novel deep learning model to distinguish malignant versus benign solid lung nodules: Med Sci Monit, 2022; 28; e936830
24. Hosny A, Parmar C, Quackenbush J, Artificial intelligence in radiology: Nat Rev Cancer, 2018; 18(8); 500-10
25. Haenssle HA, Fink C, Schneiderbauer R, Man against machine: Diagnostic performance of a deep learning convolutional neural network for dermoscopic melanoma recognition in comparison to 58 dermatologists: Ann Oncol, 2018; 29(8); 1836-42
26. Han S, Hwang SI, Lee HJ, The classification of renal cancer in 3-phase CT images using a deep learning method: J Digit Imaging, 2019; 32(4); 638-43
27. Feng Z, Rong P, Cao P, Machine learning-based quantitative texture analysis of CT images of small renal masses: Differentiation of angiomyolipoma without visible fat from renal cell carcinoma: Eur Radiol, 2018; 28(4); 1625-33
28. Yu H, Scalera J, Khalid M, Texture analysis as a radiomic marker for differentiating renal tumors: Abdom Radiol (NY), 2017; 42(10); 2470-78
29. Zhu XL, Shen HB, Sun H, Improving segmentation and classification of renal tumors in small sample 3D CT images using transfer learning with convolutional neural networks: Int J Comput Assist Radiol Surg, 2022; 17(7); 1303-11
Figures
In Press
08 Mar 2024 : Clinical Research
Evaluation of Foot Structure in Preschool Children Based on Body MassMed Sci Monit In Press; DOI: 10.12659/MSM.943765
15 Apr 2024 : Laboratory Research
The Role of Copper-Induced M2 Macrophage Polarization in Protecting Cartilage Matrix in OsteoarthritisMed Sci Monit In Press; DOI: 10.12659/MSM.943738
07 Mar 2024 : Clinical Research
Knowledge of and Attitudes Toward Clinical Trials: A Questionnaire-Based Study of 179 Male Third- and Fourt...Med Sci Monit In Press; DOI: 10.12659/MSM.943468
08 Mar 2024 : Animal Research
Modification of Experimental Model of Necrotizing Enterocolitis (NEC) in Rat Pups by Single Exposure to Hyp...Med Sci Monit In Press; DOI: 10.12659/MSM.943443
Most Viewed Current Articles
17 Jan 2024 : Review article
Vaccination Guidelines for Pregnant Women: Addressing COVID-19 and the Omicron VariantDOI :10.12659/MSM.942799
Med Sci Monit 2024; 30:e942799
14 Dec 2022 : Clinical Research
Prevalence and Variability of Allergen-Specific Immunoglobulin E in Patients with Elevated Tryptase LevelsDOI :10.12659/MSM.937990
Med Sci Monit 2022; 28:e937990
16 May 2023 : Clinical Research
Electrophysiological Testing for an Auditory Processing Disorder and Reading Performance in 54 School Stude...DOI :10.12659/MSM.940387
Med Sci Monit 2023; 29:e940387
01 Jan 2022 : Editorial
Editorial: Current Status of Oral Antiviral Drug Treatments for SARS-CoV-2 Infection in Non-Hospitalized Pa...DOI :10.12659/MSM.935952
Med Sci Monit 2022; 28:e935952