28 June 2023: Database Analysis
Telomere-Associated Gene Signatures Correlate with Prognosis, Tumor Microenvironment, and Chemosensitivity in Breast Cancer
Yuanyuan Hu1ABCDEF, Xiongbin You2ABCD, Ziwei Zhang2ABCDF, Hong Zhao1E*DOI: 10.12659/MSM.939921
Med Sci Monit 2023; 29:e939921


Abstract
BACKGROUND: Telomeres are strongly associated with cancer, as their shortening over time is associated with an increased risk of tumor growth and progression. However, the prognostic value of telomere-related genes (TRGs) in breast cancer has not been systematically elucidated.
MATERIAL AND METHODS: The transcriptome and clinical data of breast cancer were downloaded from TCGA and GEO databases, and prognostic TRGs were identified by differential expression analysis and univariate and multivariate Cox regression analyses. Gene set enrichment analysis (GSEA) of different risk groups was performed. Molecular subtypes of breast cancer were constructed by consensus clustering analysis, and the differences in immune infiltration and chemotherapy sensitivity between subtypes were analyzed.
RESULTS: Differential expression analysis revealed 86 significantly differentially expressed TRGs in breast cancer, of which 43 were significantly associated with breast cancer prognosis. A predictive risk signature consisting of 6 tumor-related genes (TRGs) was developed, which can accurately stratify patients with breast cancer into 2 distinct groups with significantly different prognoses. Significantly different risk scores were found among different racial groups, treatment groups, and pathological features groups. GSEA results showed that patients in the low-risk group had activated immune responses and repressed cilium-related biological processes. Consistent clustering analysis based on these 6 TRGs obtained 2 molecular models with significant prognosis differences, which revealed distinct immune infiltration and chemotherapy sensitivity.
CONCLUSIONS: This study conducted a systematic investigation of the expression pattern of TRGs in breast cancer and its prognostic and clustering implications, thereby offering a reference for utilizing it to predict prognosis and evaluate treatment response.
Keywords: Breast Neoplasms, Transcriptome, Telomere, Prognosis
Background
Breast cancer is the most widespread form of cancer among women worldwide [1]. It is a malignant tumor that originates from breast cells and can develop in different regions of the organ, such as the ducts, lobules, and the structures between them [2]. Diagnosis usually begins with a mammogram and an X-ray examination to detect abnormal growths in the breast [3]. Treatment for breast cancer may include surgery, radiation therapy, chemotherapy, hormone therapy, or a combination of all [4]. Despite substantial progress in the treatment of BC, there is still room for improvement. The development of more effective medications and therapies is needed to enhance survival rates, diminish adverse effects, and hinder recurrence. In addition, there is a need for a novel biomarker to accurately predict the outcomes of breast cancer patients.
Telomeres are the terminal segments of chromosomes that regulate the stability of chromosomes. Research has demonstrated that telomere length is shorter in cancer cells than in normal cells [5], and that a decrease in telomere length is associated with alterations in gene expression, genomic instability, and modified biological function [6]. Furthermore, it has been found that shortened telomeres are linked to an increased likelihood of cancer, and to a poorer prognosis in some cancers, such as breast [7], bladder [8], and prostate cancers [9]. As such, telomeres and telomerase-related genes may be useful biomarkers for cancer diagnosis, treatment, and prognosis. The TRGs-derived risk signature has been developed in a variety of cancers, such as kidney cancer [10] and non-small-cell lung cancer [11], and has been verified to possess tremendous value in prognostic prediction and selection of therapeutic agents. By contrast, the expression pattern of TRGs in breast cancer and its prognostic value remain to be elucidated. Comprehension of the mechanisms responsible for telomere regulation can further our understanding of cancer biology and may help to uncover novel therapeutic targets.
In this study, we explored the prognostic role of TRGs in BC. By analyzing expression profile data from TCGA and GEO, we identified TRGs that are associated with prognosis. Survival analysis, ROC, Cox regression, and risk score strategies were subsequently employed to develop a prognostic model and its accuracy was verified by an independent sample set. Moreover, molecular subtypes were characterized by TRGs, and the differences in the immune microenvironment and chemotherapy sensitivity among subtypes were also investigated. Finally, a nomogram integrating clinicopathological features and TRGs-derived risk signature was constructed and evaluated. The present study thereby aimed to demonstrate the importance of TRGs for BC prognosis, and construct a novel signature that accurately predicts prognosis and characterizes the immune landscape, thus improving treatment. Figure 1 contains a workflow diagram.
Material and Methods
DATA ACQUISITION AND COLLECTION OF TELOMERE-RELATED GENES:
The transcriptome data and clinical information of the TCGA-BRCA cohort were downloaded from The Cancer Genome Atlas (TCGA, (https://tcgadata.nci.nih.gov/tcga/) as the training dataset, and the GSE96058 cohort data was obtained from the GEO (https://www.ncbi.nlm.nih.gov/geo/) databases as the validation dataset. Two data sets contained 996 and 3406 BC patient samples, respectively. In addition, the telomere-related genes were obtained from the TelNet (http://www.cancertelsys.org/telnet/)[12].
DEVELOPMENT AND VALIDATION OF PROGNOSTIC SIGNATURES:
The limma package was used for differential expression analysis of TRGs, and differentially expressed TRGs (deTRGs) were filtered out with an adjusted p-value of <0.01 and an absolute logFC of >1.6. Then, the prognostic factors deTRGs were determined using univariate Cox regression analysis and further compressed using LASSO Cox regression analysis. Independent prognostic deTRGs were identified by multivariate Cox regression analysis and used to construct a prognostic risk signature using the following formula: risk score = ∑(βi*coefi) (‘i’=the number of prognostic TRGs, ‘bi’ represents the expression of each TRGs, ‘coefi’ represents the coefficient of each TRGs. The patients were stratified into 2 groups – high-risk and low-risk – based on the median score. Thereafter, the difference in overall survival (OS) between these 2 groups was assessed through the Kaplan-Meier (K-M) survival analysis. Subsequently, the performance of the risk score model was evaluated using receiver operating characteristic (ROC) curves in the survivalROC package. Furthermore, the prognostic model was validated using the external GSE96058 cohort as an independent dataset.
GENE SET ENRICHMENT ANALYSIS:
The biological significance of the risk score in BRCA was inferred using gene set enrichment analysis (GSEA). GSEA is a computational method that determines if a set of genes, defined a priori based on known biological pathways or functional annotations, is significantly enriched in a list of differentially expressed genes. In this study, the gene sets from the ‘c2.cp.kegg.v7.2.symbols.gmt [Curated]’ collection in the Molecular Signatures Database were used for GSEA analysis [13]. To assess the significance of the enrichment scores obtained from GSEA analysis, 1000 gene set permutations were conducted to obtain a normalized enrichment score for each analysis. Results were considered statistically significant if they had a nominal p-value < 0.05 and a false discovery rate q-value <0.05.
CONSENSUS CLUSTERING ANALYSIS:
Consensus clustering was utilized to identify a novel prognostic factor-associated TRG-based stratification by means of the ConsensusClusterPlus package [14]. Subsequently, a Kaplan-Meier analysis was used to assess the prognostic significance of the TRGs-defined clusters, and the distinctions in risk scores among the groups were evaluated and presented graphically.
IMMUNE INFILTRATION AND CHEMOSENSITIVITY:
CIBERSORT is an algorithm that leverages the expression values of 547 genes to quantify the composition of immune cells in tissues. Taking advantage of TCGA-TGCT cohort transcriptome data, the CIBERSORT package was employed to analyze and compare the infiltration of 22 immune cell types between the high- and low-risk groups of the TCGA-TGCT cohort [15]. Furthermore, the pRRophetic package was utilized to assess the difference in chemotherapy sensitivity between the 2 groups [16].
CONSTRUCTION AND EVALUATION OF A PREDICTIVE NOMOGRAM:
The independent prognostic factors for OS in patients with TGCT were identified through univariate and multivariate Cox proportional hazards analysis, and then used to construct a nomogram using the rms package. The established nomogram was then tested for its predictive performance through the implementation of C-index and calibration plots. The rmda package was used for decision curve analysis (DCA) to evaluate the benefit of all strategies employed in OS prediction.
STATISTICAL ANALYSIS:
All analyses were conducted with R version 4.2.2. the Kaplan-Meier method and the log rank test were applied for survival analysis. The non-parametric Wilcoxon rank sum test was utilized to evaluate the association between 2 groups in terms of continuous variables, whereas the Kruskal-Wallis test was employed for comparing more than 2 groups. All statistical investigations were deemed statistically significant at p<0.05.
Results
IDENTIFICATION OF PROGNOSTIC TRGS IN BREAST CANCER PATIENTS:
A total of 2093 telomerase-related genes were obtained using TelNet portals. Upon comparison with normal adjacent tissues, 86 TRGs showed differential expression in BC (Figure 2A). Of the 86 TRGs, 43 were identified as statistically significant for survival (p<0.01). Figure 2B shows the Hazard values for these 43 prognostic TRGs, of which 8 are protective genes and 35 belong to risk genes. The copy number variation and chromosome localization of prognostic TRGs are shown in Figure 2C and 2D. MYOM2 is predominantly exhibited as a “loss” and is mapped to chromosome 8, whereas the greatest alteration in “gain” of PCK1 is situated on chromosome 20.
CONSTRUCTION OF TRGS-DERIVED RISK SIGNATURE FOR BREAST CANCER PATIENTS:
Through LASSO Cox regression analysis, 43 prognosis-related TRGs were reduced to 19 optimized prognosis TRGs (Figure 3A, 3B). Additionally, multivariable Cox regression analysis identified 6 independent prognostic TRGs. A forest plot of these 6 independent prognosis TRGs is shown in Figure 3C, where IQSEC3 and PLCZ1 are risk genes and DMD, FOXJ1, FOXP3, and RHBDL1 are protective genes. Three of the genes (DMD, IQSEC3, and PLCZ1) showed significantly lower expression in cancerous tissues, while the other 3 (FOXJ1, FOXP3, and RHBDL1) showed significantly higher expression in cancerous tissues (Figure 3D). By using median gene expression, the TCGA-BRCA cohort was stratified into a high-expression group and a low-expression group, and then intergroup K-M analysis was conducted. The difference in prognosis between the 2 expression groups significant for FOXP3, FOXJ1, and RHBDL1, and all showed that the OS was better in the high-expression group, as shown in Supplementary Figure 1.
Next, we calculated the risk scores for patients in the TCGA-BRCA cohort and the GSE96058 cohort using the following formula: −0.5438717*DMD − 0.2255083*FOXJ1−0.4906376*FOXP3 + 1.0678422*IQSEC3 + 2.4806876* PLCZ1−0.5695720*RHBDL1, and divided the cohorts into high- and low-risk groups based on the median values of the risk scores, as shown in Figure 4A, 4B. Supplementary Figure 2A and 2B illustrate scatterplots of survival time and status for the TCGA-BRCA cohort and GSE96058 cohort, respectively. Additionally, expression heatmaps of 6 TRGs in the TCGA-BRCA cohort and GSE96058 cohort are shown in Supplementary Figure 2C and 2D. The K-M survival analysis revealed significant variations in prognosis among the distinct risk categories, while the high-risk group had a poorer prognosis in the TCGA-BRCA cohort (Figure 4C, p<0.001) and in the GSE96058 cohort (Figure 4D, p=0.002).
CLINICAL RELEVANCE OF RISK MODELS AND GSEA:
There were significant differences in risk scores among patients with different clinical and pathological characteristics. Specifically, patients who died had a significantly higher risk scores than those who survived (Figure 5A, p=7.5e-12). Patients who did not receive radiation therapy also had a higher risk score than those who did (Figure 5B, p=0.033). Furthermore, we observed that White (p=0.0014) and Asian (p=0.028) patients had higher risk scores than Black patients (Figure 5C). Among patients with different tumor stages, those with T4 stage had significantly higher risk scores compared to those with T3 (p=0.045), T2 (p=0.041), and T1 (p=0.0095) stages (Figure 5D). Additionally, our analysis revealed that patients with N1 stage had higher risk scores compared to those with N0 stage, while no significant difference in risk score was observed between other clinical and pathological groups (Supplementary Figure 3). The findings of the GSEA analysis revealed significant activation of immune-related biological processes in the low-risk group, accompanied by noticeable suppression of cilium-related processes. Furthermore, several signaling pathways and cytokines demonstrated marked activation, whereas ribosome-related pathways exhibited conspicuous inhibition (Figure 6A, 6B).
TRGS-DERIVED MOLECULAR SUBTYPES OF BREAST CANCER:
The risk model utilized 6 TRGs to partition the BRCA samples into distinct subgroups based on expression profile similarities. Our analysis revealed that a clustering stability of highest quality was achieved with k=2. Notably, an increasing trend in the cumulative distribution function (CDF) value was deemed indicative of successful clustering (Figure 7A, 7B). Therefore, 2 distinct molecular subtypes were ultimately discerned. These subtypes were designated as cluster 1 (713 samples) and cluster 2 (283 samples). Cluster 2 exhibited a significantly prolonged median survival time in comparison to cluster 1, which displayed the poorest prognosis (Figure 7C, p=0.0079). A comparison of the risk scores among clusters demonstrated that cluster 1 presented significantly higher risk scores than cluster 2 (Figure 7D).
IMMUNE LANDSCAPE AND CHEMOSENSITIVITY BETWEEN MOLECULAR CLUSTERS:
We compared the sensitivity of 2 molecular subtypes to 10 chemotherapeutic agents and revealed that they significantly diverged in terms of sensitivity to 7 of these agents, including cisplatin, metformin, lapatinib, vinblastine, paclitaxel, methotrexate, and vinorelbine, indicating that these genes may play a vital role in chemotherapy response (Figure 8A). Furthermore, we analyzed the immune infiltration between the different molecular subtypes. As demonstrated in Figure 8B, there were substantial discrepancies in the levels of infiltration of 7 immune cells between the 2 subtypes, with naive B cells, plasma cells, activated CD4 memory T cells, gamma delta T cells, and resting NK cells at higher levels in cluster 1, and M0 macrophages and resting mast cells at reduced levels in cluster 1. Further categorization and analysis of these immune cells revealed that cluster 1 had significantly elevated infiltration levels of lymphocytes and significantly reduced infiltration levels of macrophage and mast cells (Figure 8C).
DEVELOPMENT AND EVALUATION OF TRGS-CORRELATED CLINICOPATHOLOGIC NOMOGRAM:
Univariate Cox regression analysis revealed that risk score, radiotherapy, chemotherapy, clinical stage, and T, N, and M stages were significantly associated with BC prognosis. Subsequently, the risk score, radiotherapy, and N stage were identified as 3 independent risk prognostic factors of BC (Table 1). Moreover, a nomogram was constructed that integrates the risk score, N stage, and radiotherapy to forecast the OS of BC patients (Figure 9A). The nomogram achieved a C-index of 0.79 in the TCGA-BRCA cohort, indicating its high discriminative ability. The calibration plots also exhibited excellent predictive accuracy, as demonstrated by their close agreement with the ideal model (Figure 9B). Additionally, decision curve analysis confirmed the superior performance of the nomogram in predicting patient outcomes compared to alternative strategies (Figure 9C). Overall, these findings suggest that the developed nomogram is a highly effective tool for prognostication in BC patients.
Discussion
Breast cancer is a highly malignant neoplasm that is responsible for the greatest number of cancer-related deaths among women in most countries [1]. The sensitivity of treatment and clinical outcomes are influenced by the heterogeneity of the tumor microenvironment and the genotype of cancer cells. Therefore, it is essential to molecularly subtype breast cancer and explore its genomic heterogeneity in order to determine treatment sensitivity and improve prognosis [17]. Advancements in technology have rendered the current TNM staging system inadequate to meet the clinical requirements [18]. Therefore, it is crucial to identify new and effective markers for evaluating the survival of patients with breast cancer and for developing treatment plans.
Telomeres play an essential role in the development of breast cancer. The present study is the first to assess the role of telomere-related genes in the prognosis of breast cancer. We have constructed a prognostic model based on telomere-related genes using public databases, and built 2 molecular subtypes based on 6 TRGs. The immunoinfiltration and chemotherapy sensitivity analysis revealed significant differences in the immunological microenvironment and chemotherapy sensitivity of the prognostic TRGs-derived molecular subtypes, indicating its potential application value in the field of targeted therapy for breast cancer. At the same time, we constructed a nomogram combining the risk model derived from TRGs and clinical pathological features and evaluated its efficacy in the prognosis of breast cancer, providing a foundation for development of individualized treatment of breast cancer.
In this study, 6 genes – IQSEC3, PLCZ1, DMD, FOXJ1, FOXP3, and RHBDL1 – were identified as constituting robust risk score characteristics. Extensive correlations between these TRGs and tumorigenesis and pathogenesis have been reported in previous studies. Forkhead Box J1 (FOXJ1), a member of the Fox gene family, is involved in complex and essential processes such as development, organogenesis, and regulation of the immune system, as well as progression of various forms of malignancy [19,20]. It has been suggested that FOXJ1 can act as a tumor suppressor, influencing cell survival/invasion, and having a possible influence on cancer proliferation/metastasis [21,22]. FOXP3, a transcription factor, is key in the development and function of the immune system. FOXP3 promotes tumor growth and metastasis by activating the Wnt/β-catenin signaling pathway and EMT in non-small-cell lung cancer [23]. Inhibitors of FOXP3 were proposed as a novel cancer immunotherapy approach [24]. FOXP3 was found to interact closely with immune biomarkers on tumor-infiltrating cells in the tumor microenvironment of patients with small-cell lung cancer [25]. Dystrophin (DMD) was found to inhibit myogenic sarcoma cell migration, invasion, anchorage independence, and invadopodia formation, and was hypothesized to act as a tumor suppressor and likely anti-metastatic factor [26]. IQSEC3, PLCZ1, and RHBDL1 were identified in this study as novel prognostic markers for breast cancer. Further research is necessary to explore the roles of these genes in the tumorigenesis and pathogenesis of breast cancer, and to provide more potential targets for targeted therapy of breast cancer.
According to GSEA, the low-risk groups derived from TRGs were characterized by upregulated immune response-related and downregulated cilium-related biological processes. Research has demonstrated that activation of the immune response can effectively curb the proliferation and metastasis of tumor cells, fortify the immune system, diminish the development of the tumor microenvironment, and enhance the efficacy of antitumor drugs [27]. Moreover, such activation can also repress tumor cell resistance to antitumor drugs, which has a beneficial impact on the treatment of tumors [28]. Furthermore, the occurrence of tumor cells might be linked to cilium dysfunction, and impeding cilium formation could reduce the possibility of tumor occurrence [29]. In addition, many upregulated pathways and downregulated ribosome pathways were observed in the low-risk group.
We employed unsupervised cluster analysis to distinguish BC patients into 2 molecular subtypes (clusters 1 and 2) based on 6 TRGs, with most of them highly expressed in cluster 1 and linked to a worse prognosis. Expression analysis of telomere biology-related genes revealed higher levels of TERF2, TNRF2IP, TEP1, PINX1, and KLF4, and lower levels of TINF2, WRAP53, ZBTB48, POT1, NVL, and CTC1 in cluster 1. TERF2, PINX1, and KLF4 were found to reduce telomere length [30–32], while TINF2 as a haploinsufficient tumor suppressor limits telomere length [33], and editing TINF2 is proposed as a potential therapeutic approach to restore telomere length [34]. WRAP53 is required for telomere addition by telomerase [35], and ZBTB48 acts as a negative regulator of telomere length [36]. POT1 impeded the recruitment of telomerase to telomeres, leading to progressive telomere shortening [37]. CTC1 deletion caused defective telomere replication, resulting in catastrophic telomere loss [38]. Telomere length is significantly negatively correlated with the prognosis of breast cancer patients [39]; the better prognosis of cluster 2 may be attributed to the telomere length maintained by these telomere length-related genes.
The tumor immune microenvironment is a critical determinant of tumor growth and response to therapy, with immune cell infiltration playing a pivotal role. Our findings indicate substantial disparities in immune cell infiltration patterns across distinct molecular subtypes of breast cancer, specifically involving B cells, T cells, and macrophages. Research has demonstrated that naive B cells are associated with a poor prognosis in breast cancer patients [40]. Moreover, higher amounts of naive B cells in the tumor microenvironment are believed to enhance metastasis and are related to tamoxifen resistance [41]. The relationship between breast cancer and infiltrated CD4 memory T cells is complicated, but studies suggest that CD4 memory T cells have a role in both preventing and progressing the disease [42]. Specifically, higher numbers of CD4 memory T cells are linked to better clinical results, while infiltration of CD4 memory T cells can promote tumor cell proliferation, thus furthering breast cancer [43]. Consequently, understanding the dynamic relationship between them is important for establishing more effective treatment strategies. Moreover, increased infiltration of M0 macrophages in the tumor microenvironment is correlated with a more aggressive and metastatic form of breast cancer. They are also a source of pro-tumorigenic cytokines and growth factors, which contribute to the growth and spread of breast cancer cells. All these findings indicate that TRGs-derived breast cancer molecular subtypes differ in their immunological profiles, which determines their chemotherapy and immunotherapy response, thus impacting prognosis. Chemotherapy sensitivity analysis also proved the distinct sensitivity of each molecular subtype to certain drugs.
Conclusions
In conclusion, we established and validated a risk signature based on 6 independent prognostic TRGs. Molecular subtypes of BC were also constructed using the 6 TRGs, which showed significant differences in prognosis, immune infiltration and chemotherapy sensitivity. However, there were no experiments to validate our findings. The model we have constructed may be helpful in the selection of treatment agents for breast cancer patients.
Figures
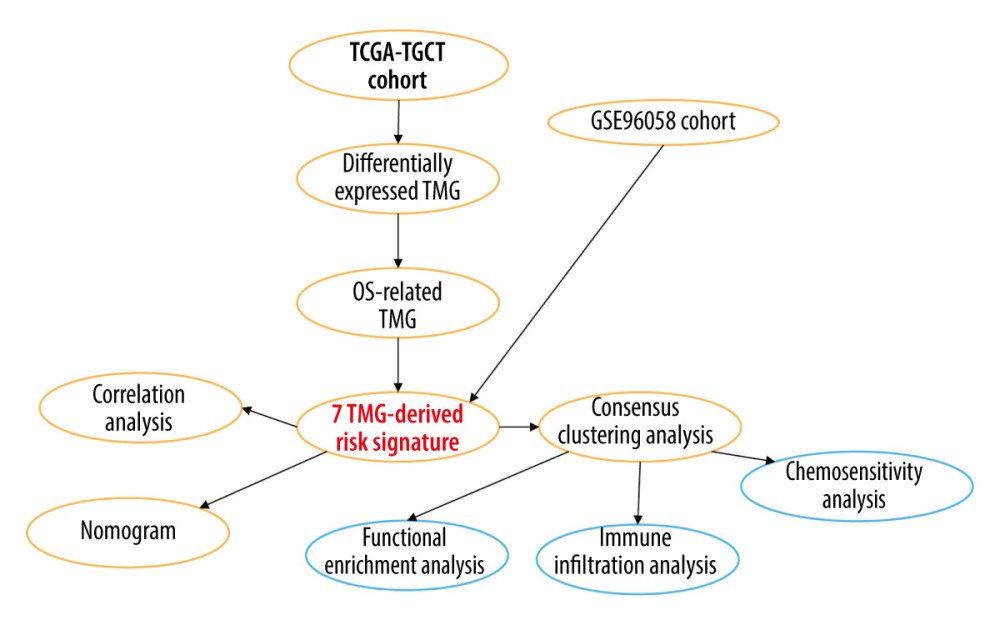 Figure 1. A detailed flow chart for establishing a TRGs-based risk signature to predict the prognosis of BC. (Adobe, version 26.0).
 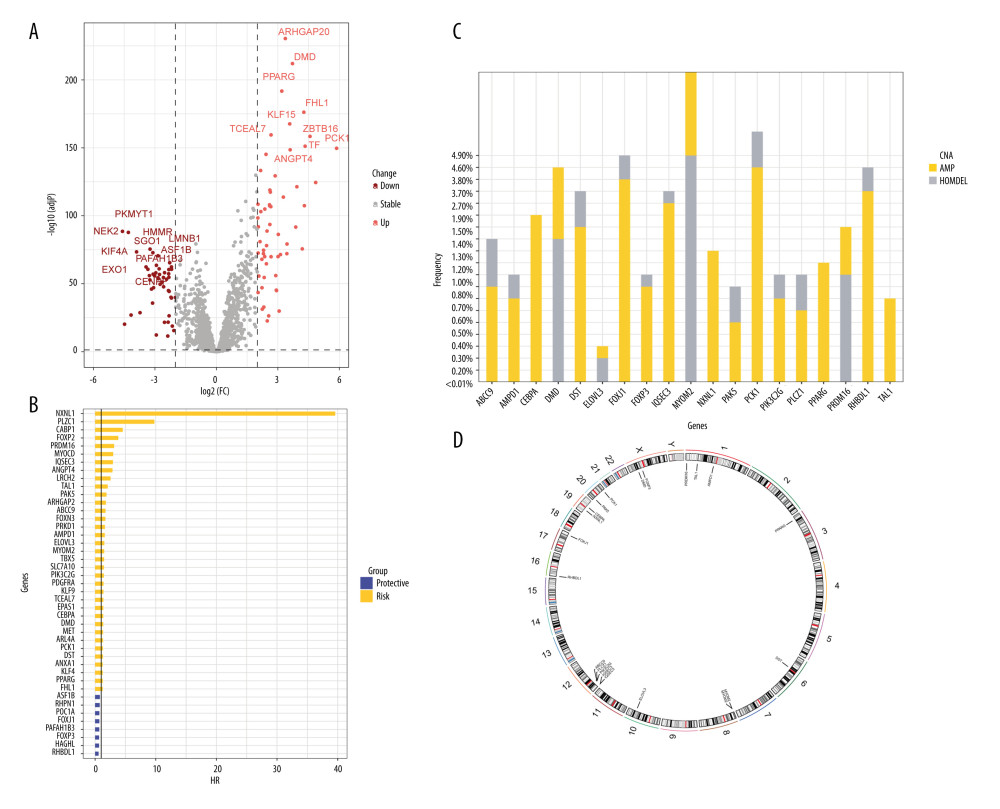 Figure 2. The identification of differentially expressed TRGs and prognostic TRGs. (A) A volcano plot of differential expression of TRGs between breast cancer and normal tissue. (B) HR distribution of OS-related TRGs. (C) Copy number mutations in “gain” and “loss” of OS-related TRGs obtained from LASSO Cox regression analysis and their chromosomal locations. (D) Chromosome localization of TRGs associated with OS. (R software, version 4.2.2, Adobe, version 26.0).
 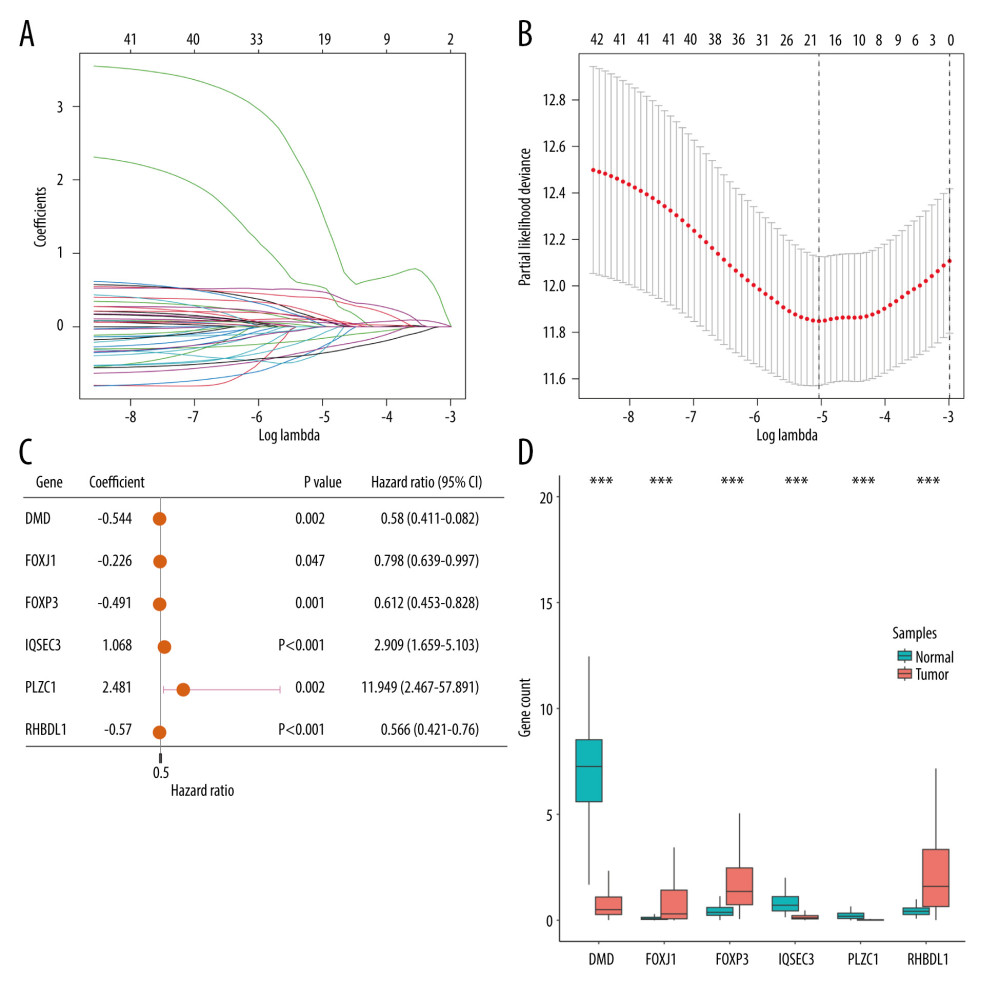 Figure 3. Identification of candidate TRGs for generating risk model of BC. (A) Lasso coefficient profiles of the TRGs. A coefficient profile plot was produced against log(lambda) sequence. (B) Ten-fold cross-validation for selection of the parameter λ. (C) Forest plot of the 6 independent prognostic TRGs in the TCGA-BRCA cohort. (D) Comparison of the gene expression of the 6 independent prognostic TRGs between the breast cancer and normal tissues. (R software, version 4.2.2, Adobe, version 26.0).
 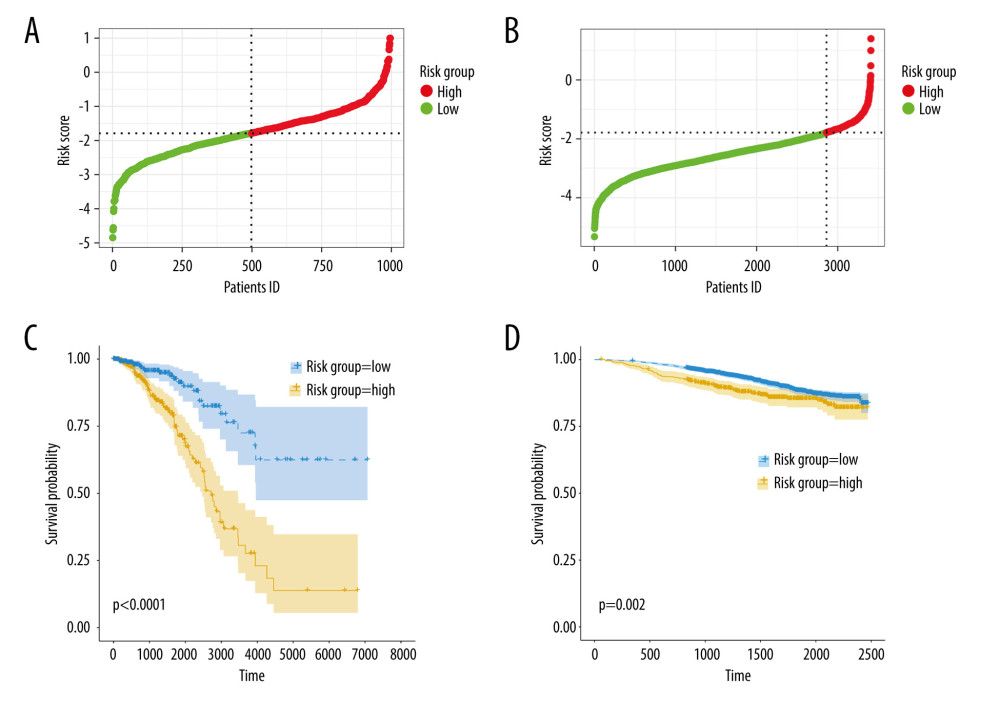 Figure 4. Construction and validation of TRGs-derived risk signature. (A, B) The distribution of risk scores in the TCGA-BRCA cohort and GSE96058 cohort. (C, D) K-M survival analysis of the risk signature in the TCGA-BRCA cohort and GSE96058 cohort. (R software, version 4.2.2, Adobe, version 26.0).
 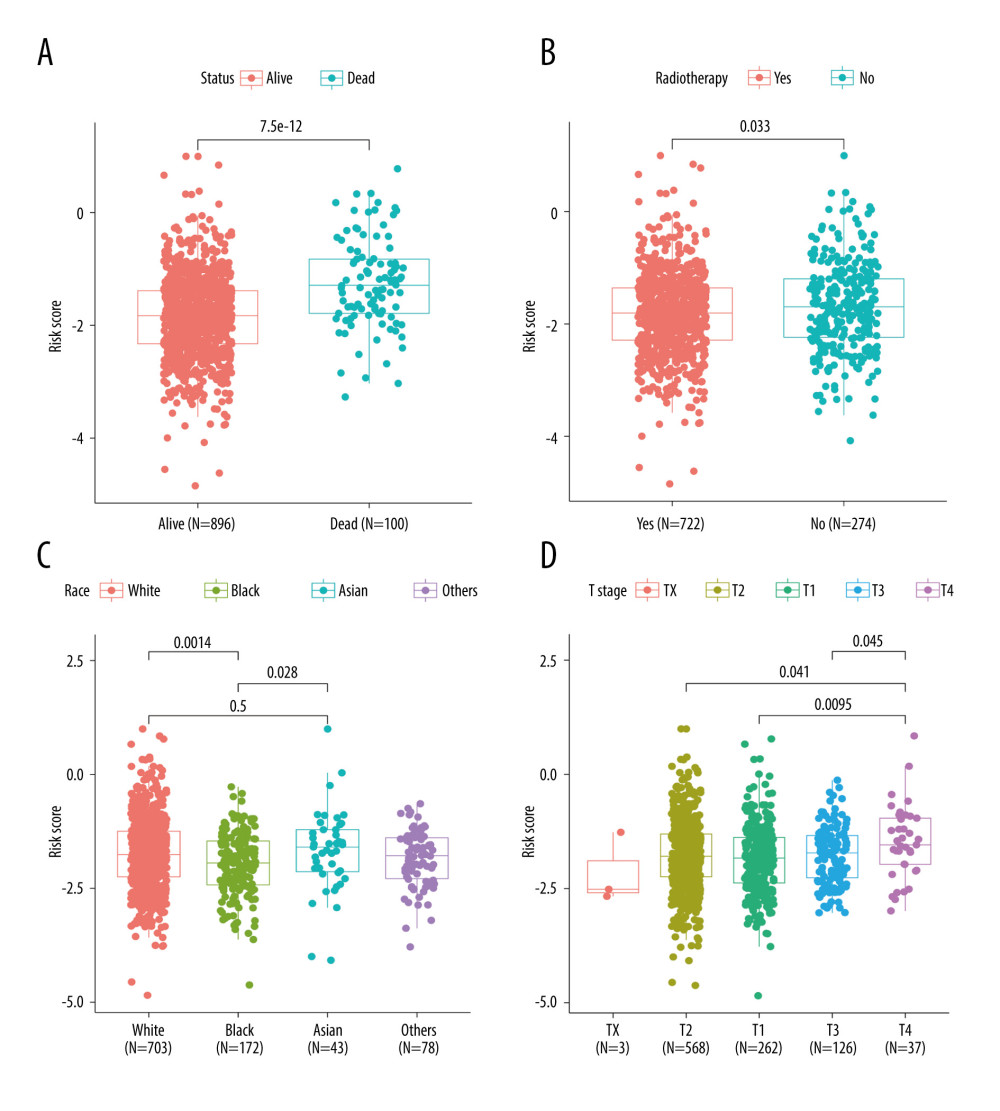 Figure 5. Correlations between clinicopathological features and TRGs-based risk model. Comparison of the risk score in different groups separated by survival status (A), radiotherapy (B), race (C), and T stage (D). (R software, version 4.2.2, Adobe, version 26.0).
 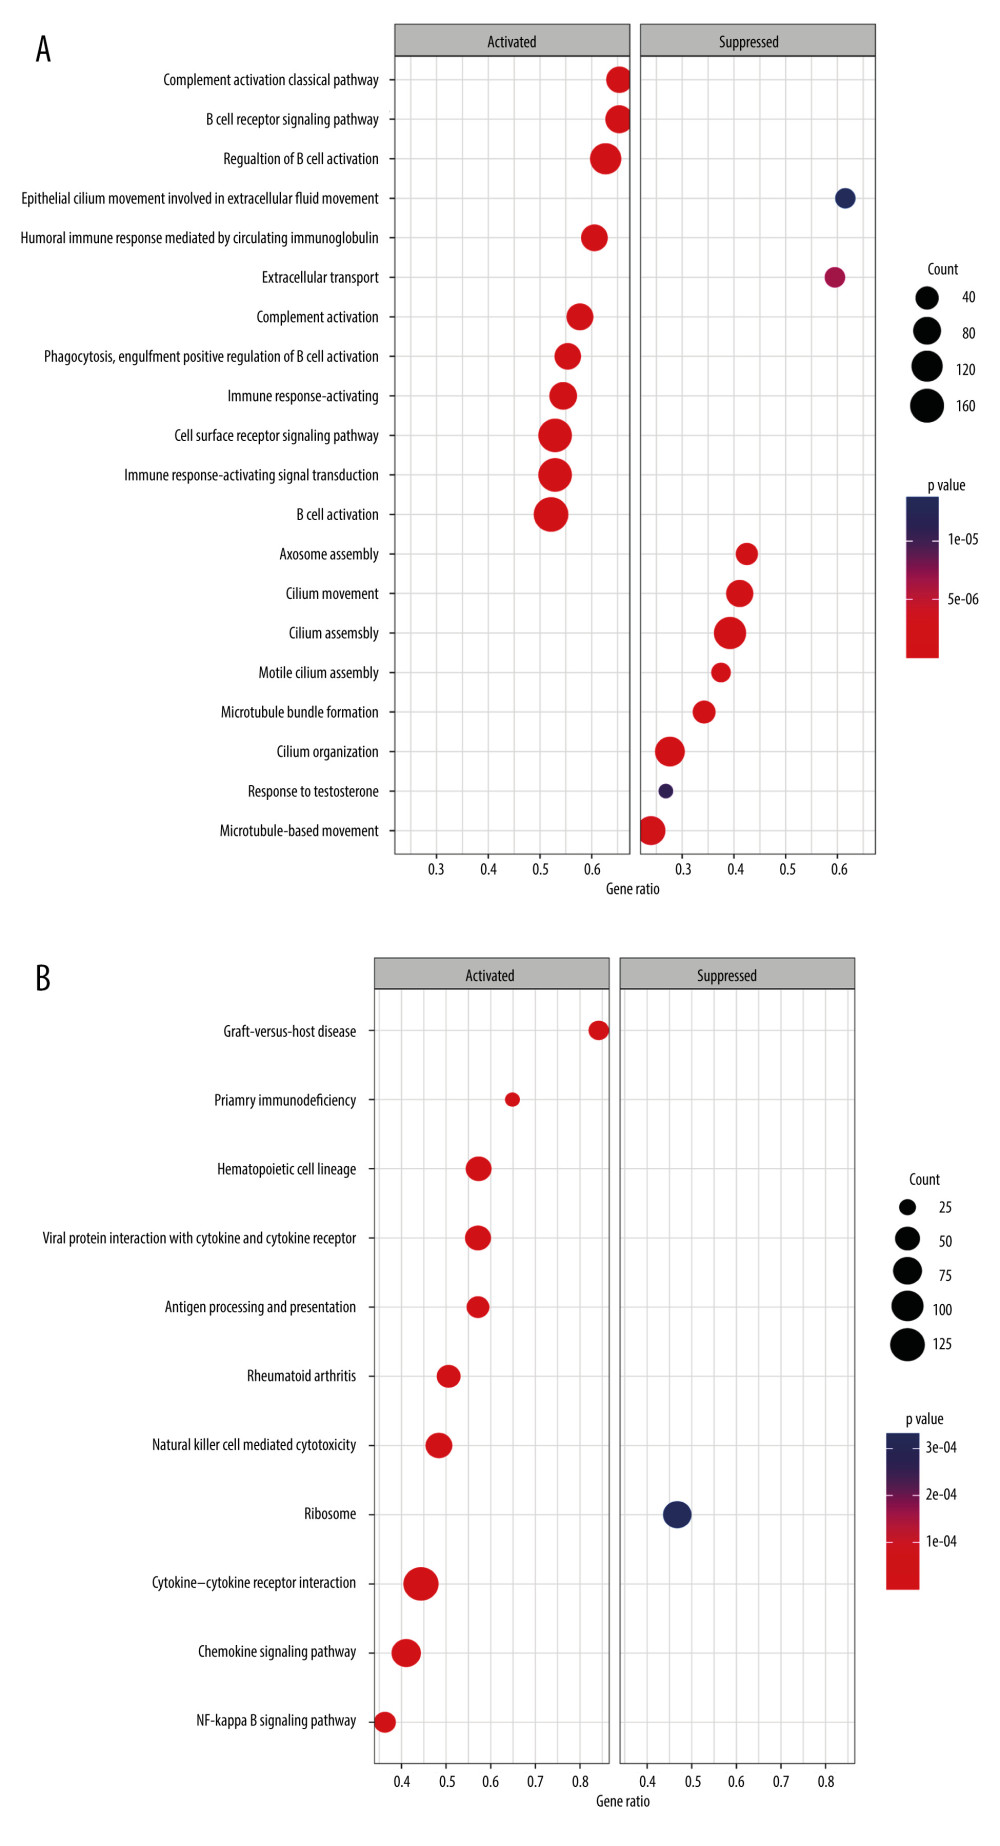 Figure 6. GSEA results of between the high- and low-risk groups in the TCGA-BRCA cohort. (A) The bubble plot of the top 20 enriched GO terms. (B) The bubble plot of the enriched KEGG pathways. (R software, version 4.2.2, Adobe, version 26.0).
 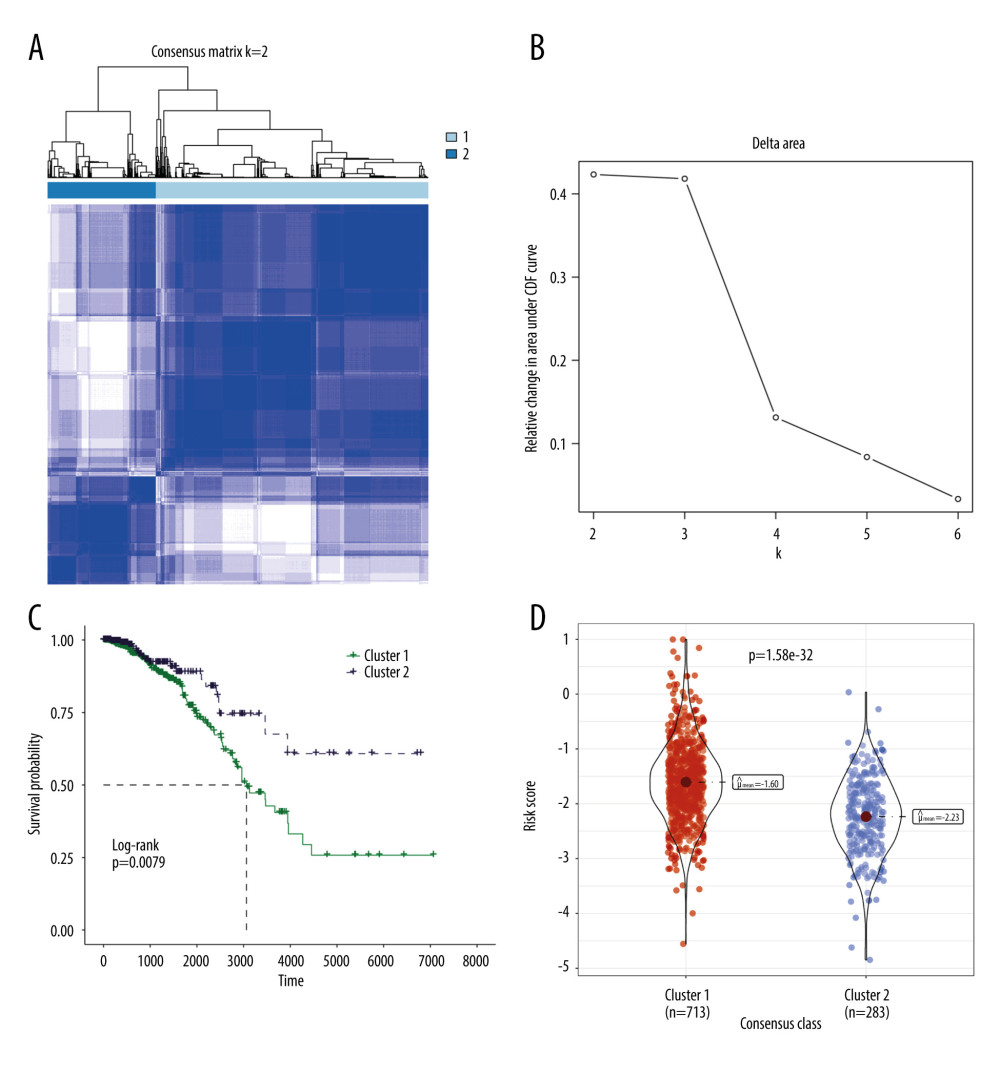 Figure 7. Molecular subtypes of breast cancer identified by consensus clustering analysis. (A) The consensus score matrix of all samples when k=2 in the TCGA-TGCT cohort. (B) The corresponding relative change in area under the cumulative distribution function (CDF) curves when cluster number changes from k to k+1. (C) K-M survival analysis of the TRGs-derived subtypes in the TGCA-BRCA cohort. (D) Comparison of the risk scores between the cluster 1 and cluster 2. (R software, version 4.2.2, Adobe, version 26.0).
 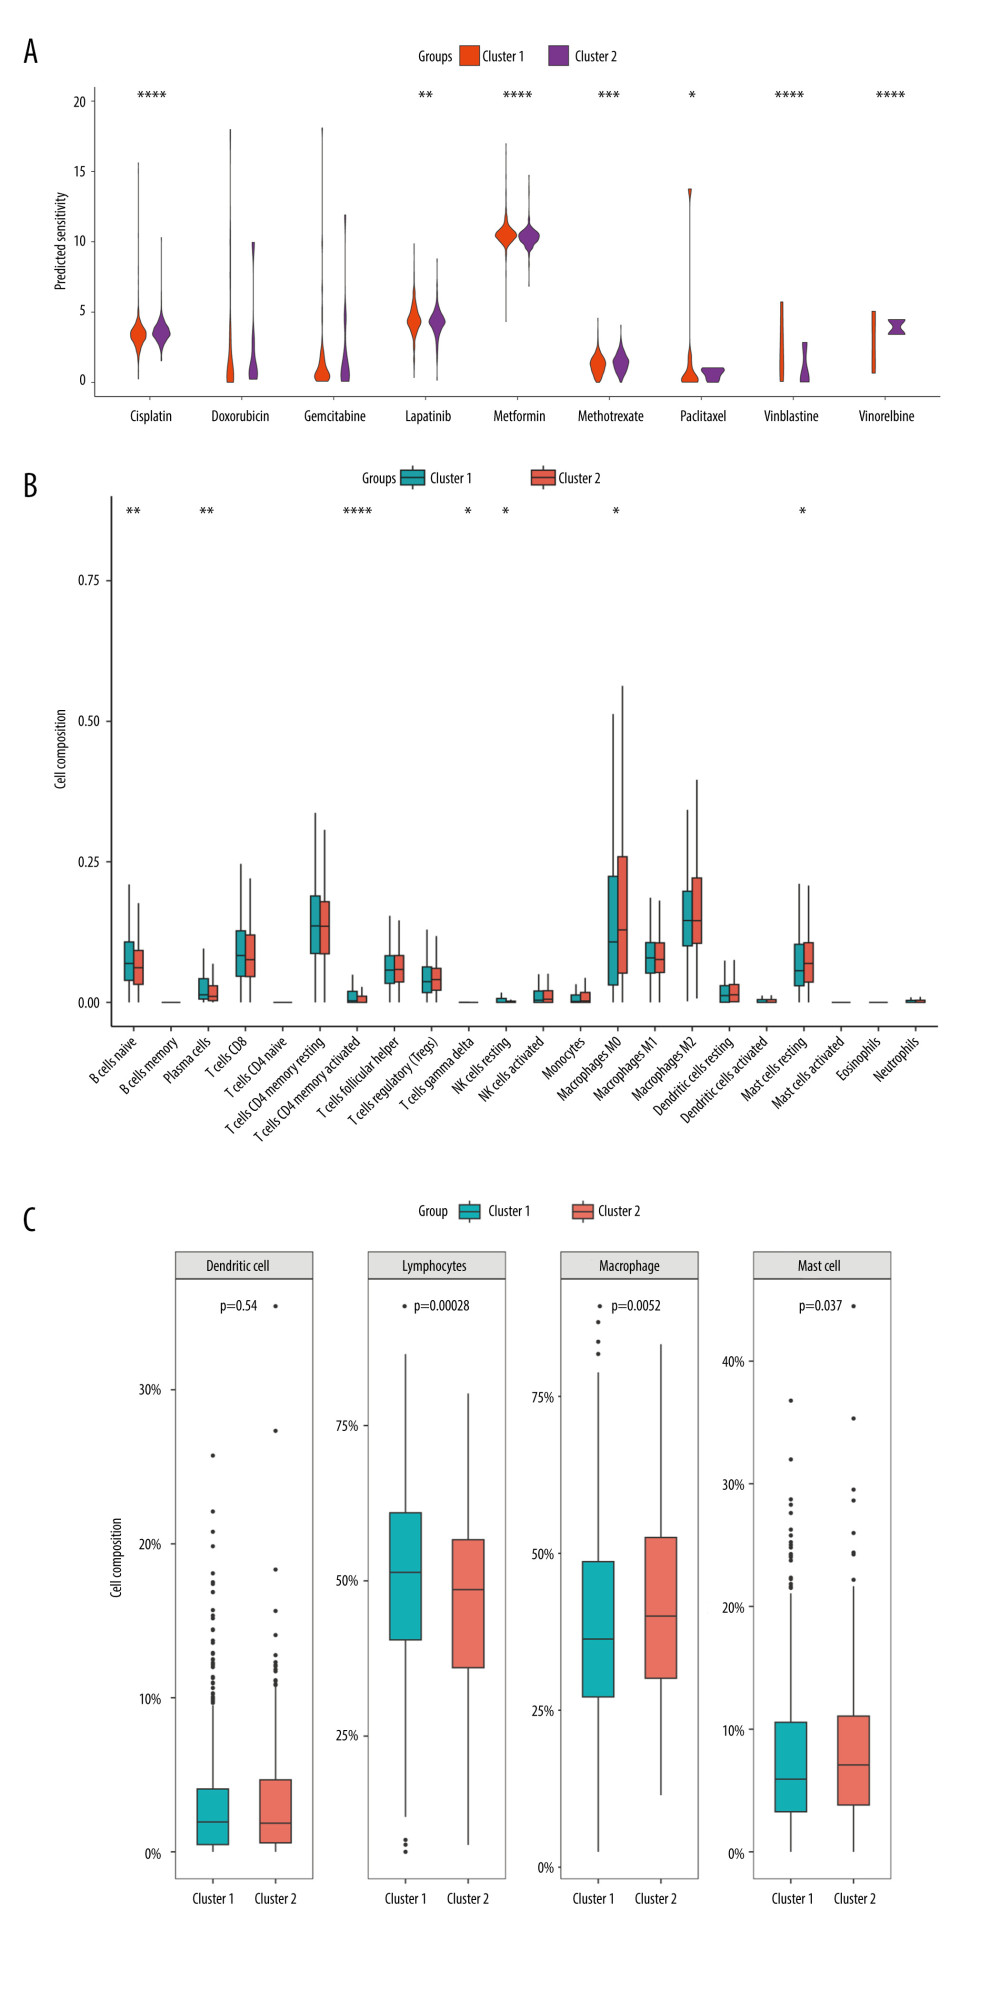 Figure 8. Immune infiltration and chemosensitivity among molecular subtypes derived from TRGs. (A) Comparison of the chemosensitivities between cluster 1 and cluster 2 to drugs. (B) comparison of the cell composition of 22 immune cells between cluster1 and cluster 2. (C) Comparison of 4 types of immune cells between cluster 1 and cluster 2. (R software, version 4.2.2, Adobe, version 26.0).
 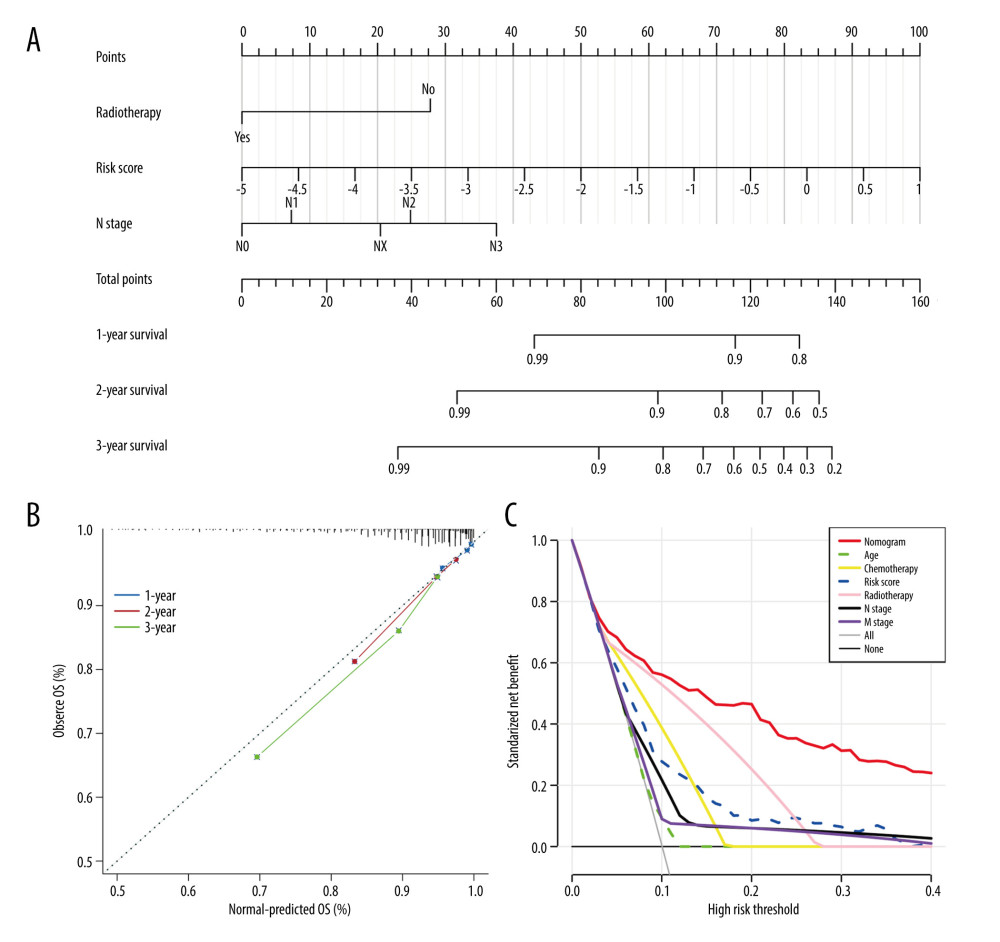 Figure 9. Construction and validation a nomogram for predicting OS of BC. (A) A nomogram comprising of 4 factors including age, radiotherapy, N stage, and TRGs-based risk model. (B) The calibration curve of the nomogram. (C) DCA curves of the nomogram and various signal predictor. (R software, version 4.2.2, Adobe, version 26.0).
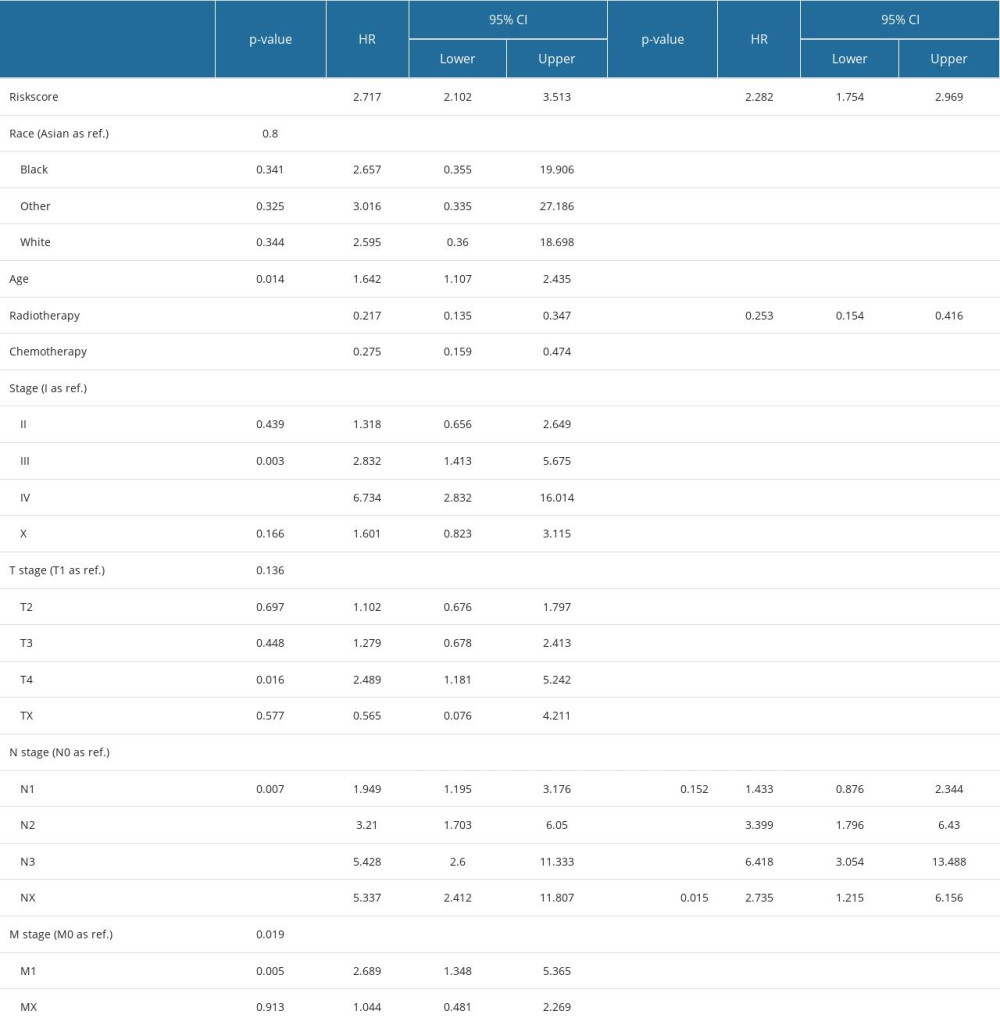
References
1. Giaquinto AN, Sung H, Miller KD, Breast cancer statistics, 2022: Cancer J Clin, 2022; 72(6); 524-41
2. Feng Y, Spezia M, Huang S, Breast cancer development and progression: Risk factors, cancer stem cells, signaling pathways, genomics, and molecular pathogenesis: Genes Dis, 2018; 5(2); 77-106
3. Huang X, Cai S, Wu P, Clinical and X-ray characteristics for expressions of different receptors in patients with breast cancer: Zhong Nan Da Xue Xue Bao Yi Xue Ban, 2021; 46(3); 263-71
4. McDonald ES, Clark AS, Tchou J, Clinical diagnosis and management of breast cancer: J Nucl Med, 2016; 57(Suppl 1); 9S-16S
5. Barthel FP, Wei W, Tang M, Systematic analysis of telomere length and somatic alterations in 31 cancer types: Nat Genet, 2017; 49(3); 349-57
6. Guterres AN, Villanueva J, Targeting telomerase for cancer therapy: Oncogene, 2020; 39(36); 5811-24
7. Ennour-Idrissi K, Maunsell E, Diorio C, Telomere length and breast cancer prognosis: A systematic review: Cancer Epidemiol Biomarkers Prev, 2017; 26(1); 3-10
8. Chen M, Xu Y, Xu J, Leukocyte telomere length and bladder cancer risk: A large case-control study and mendelian randomization analysis: Cancer Epidemiol Biomarkers Prev, 2021; 30(1); 203-9
9. Livingstone J, Shiah YJ, Yamaguchi TN, The telomere length landscape of prostate cancer: Nat Commun, 2021; 12(1); 6893
10. Li SC, Jia ZK, Yang JJ, Telomere-related gene risk model for prognosis and drug treatment efficiency prediction in kidney cancer: Front Immunol, 2022; 13; 975057
11. Liu XG, Li M, Mai SJ, Telomere length-related signature as a novel biomarker of prognosis and immune response in non-small cell lung cancer: Eur Rev Med Pharmacol Sci, 2022; 26(4); 1304-19
12. Braun DM, Chung I, Kepper N, TelNet – a database for human and yeast genes involved in telomere maintenance: BMC Genet, 2018; 19(1); 32
13. Subramanian A, Tamayo P, Mootha VK, Gene set enrichment analysis: A knowledge-based approach for interpreting genome-wide expression profiles: Proc Natl Acad Sci USA, 2005; 102(43); 15545-50
14. Wilkerson MD, Hayes DN, ConsensusClusterPlus: A class discovery tool with confidence assessments and item tracking: Bioinformatics, 2010; 26(12); 1572-73
15. Newman AM, Liu CL, Green MR, Robust enumeration of cell subsets from tissue expression profiles: Nat Methods, 2015; 12(5); 453-57
16. Geeleher P, Cox N, Huang RS, pRRophetic: An R package for prediction of clinical chemotherapeutic response from tumor gene expression levels: PLoS One, 2014; 9(9); e107468
17. So JY, Ohm J, Lipkowitz S, Triple negative breast cancer (TNBC): Non-genetic tumor heterogeneity and immune microenvironment: Emerging treatment options: Pharmacol Ther, 2022; 237; 108253
18. Teichgraeber DC, Guirguis MS, Whitman GJ: Am J Roentgenol, 2021; 217(2); 278-90
19. Chen HW, Huang XD, Li HC, Expression of FOXJ1 in hepatocellular carcinoma: Correlation with patients’ prognosis and tumor cell proliferation: Mol Carcinog, 2013; 52(8); 647-59
20. Xian S, Shang D, Kong G, FOXJ1 promotes bladder cancer cell growth and regulates Warburg effect: Biochem Biophys Res Commun, 2018; 495(1); 988-94
21. Liu K, Fan J, Wu J, Forkhead Box Protein J1 (FOXJ1) is overexpressed in colorectal cancer and promotes nuclear translocation of β-catenin in SW620 cells: Med Sci Monit, 2017; 23; 856-66
22. Liu L, Zhang P, Shao Y, Knockdown of FOXJ1 inhibits the proliferation, migration, invasion, and glycolysis in laryngeal squamous cell carcinoma cells: J Cell Biochem, 2019; 120(9); 15874-82
23. Yang S, Liu Y, Li MY, FOXP3 promotes tumor growth and metastasis by activating Wnt/β-catenin signaling pathway and EMT in non-small cell lung cancer: Mol Cancer, 2017; 16(1); 124
24. Revenko A, Carnevalli LS, Sinclair C, Direct targeting of FOXP3 in Tregs with AZD8701, a novel antisense oligonucleotide to relieve immunosuppression in cancer: J Immunother Cancer, 2022; 10(4); e003892
25. Jiang M, Wu C, Zhang L, FOXP3-based immune risk model for recurrence prediction in small-cell lung cancer at stages I–III: J Immunother Cancer, 2021; 9(5); e002339
26. Wang Y, Marino-Enriquez A, Bennett RR, Dystrophin is a tumor suppressor in human cancers with myogenic programs: Nat Genet, 2014; 46(6); 601-6
27. Blagih J, Buck MD, Vousden KH, p53, cancer and the immune response: J Cell Sci, 2020; 133(5); jcs237453
28. Zhao Y, Oreskovic E, Zhang Q, Transposon-triggered innate immune response confers cancer resistance to the blind mole rat: Nat Immunol, 2021; 22(10); 1219-30
29. Wang B, Liang Z, Liu P, Functional aspects of primary cilium in signaling, assembly and microenvironment in cancer: J Cell Physiol, 2021; 236(5); 3207-19
30. Alves-Paiva RM, Do NS, De Oliveira D, Senescence state in mesenchymal stem cells at low passages: Implications in clinical use: Front Cell Dev Biol, 2022; 10; 858996
31. Darvishi FZ, Saadat M, Morphine treatment is associated with diminished telomere length together with down-regulated TERT and TERF2 mRNA levels: Drug Alcohol Depend, 2021; 227; 108982
32. Oh BK, Yoon SM, Lee CH, Rat homolog of PinX1 is a nucleolar protein involved in the regulation of telomere length: Gene, 2007; 400(1–2); 35-43
33. Schmutz I, Mensenkamp AR, Takai KK, TINF2 is a haploinsufficient tumor suppressor that limits telomere length: Elife, 2020; 9; e61235
34. Choo S, Lorbeer FK, Regalado SG, Editing TINF2 as a potential therapeutic approach to restore telomere length in dyskeratosis congenita: Blood, 2022; 140(6); 608-18
35. Qiu H, Zhao DY, Yuan LM, Regulatory effects of WRAP53 on radiosensitivity of laryngeal squamous cell carcinoma cells: Asian Pac J Cancer Prev, 2015; 16(7); 2975-79
36. Jahn A, Rane G, Paszkowski-Rogacz M, ZBTB48 is both a vertebrate telomere-binding protein and a transcriptional activator: EMBO Rep, 2017; 18(6); 929-46
37. Li Y, Li X, Cao M, Seryl tRNA synthetase cooperates with POT1 to regulate telomere length and cellular senescence: Signal Transduct Target Ther, 2019; 4; 50
38. Gu P, Min JN, Wang Y, CTC1 deletion results in defective telomere replication, leading to catastrophic telomere loss and stem cell exhaustion: EMBO J, 2012; 31(10); 2309-21
39. Li Y, Ma L, Relationship between telomere length and the prognosis of breast cancer based on estrogen receptor status: A Mendelian randomization study: Front Oncol, 2022; 12; 1024772
40. Lin S, Tan Z, Cui H, Identification of glycogene signature as a tool to predict the clinical outcome and immunotherapy response in breast cancer: Front Oncol, 2022; 12; 854284
41. Gao Y, Zhang W, Liu C, miR-200 affects tamoxifen resistance in breast cancer cells through regulation of MYB: Sci Rep, 2019; 9(1); 18844
42. Liu D, Vadgama J, Wu Y, Basal-like breast cancer with low TGFβ and high TNFα pathway activity is rich in activated memory CD4 T cells and has a good prognosis: Int J Biol Sci, 2021; 17(3); 670-82
43. Nelson MA, Ngamcherdtrakul W, Luoh SW, Prognostic and therapeutic role of tumor-infiltrating lymphocyte subtypes in breast cancer: Cancer Metastasis Rev, 2021; 40(2); 519-36
Figures
Figure 1. A detailed flow chart for establishing a TRGs-based risk signature to predict the prognosis of BC. (Adobe, version 26.0).Figure 2. The identification of differentially expressed TRGs and prognostic TRGs. (A) A volcano plot of differential expression of TRGs between breast cancer and normal tissue. (B) HR distribution of OS-related TRGs. (C) Copy number mutations in “gain” and “loss” of OS-related TRGs obtained from LASSO Cox regression analysis and their chromosomal locations. (D) Chromosome localization of TRGs associated with OS. (R software, version 4.2.2, Adobe, version 26.0).Figure 3. Identification of candidate TRGs for generating risk model of BC. (A) Lasso coefficient profiles of the TRGs. A coefficient profile plot was produced against log(lambda) sequence. (B) Ten-fold cross-validation for selection of the parameter λ. (C) Forest plot of the 6 independent prognostic TRGs in the TCGA-BRCA cohort. (D) Comparison of the gene expression of the 6 independent prognostic TRGs between the breast cancer and normal tissues. (R software, version 4.2.2, Adobe, version 26.0).Figure 4. Construction and validation of TRGs-derived risk signature. (A, B) The distribution of risk scores in the TCGA-BRCA cohort and GSE96058 cohort. (C, D) K-M survival analysis of the risk signature in the TCGA-BRCA cohort and GSE96058 cohort. (R software, version 4.2.2, Adobe, version 26.0).Figure 5. Correlations between clinicopathological features and TRGs-based risk model. Comparison of the risk score in different groups separated by survival status (A), radiotherapy (B), race (C), and T stage (D). (R software, version 4.2.2, Adobe, version 26.0).Figure 6. GSEA results of between the high- and low-risk groups in the TCGA-BRCA cohort. (A) The bubble plot of the top 20 enriched GO terms. (B) The bubble plot of the enriched KEGG pathways. (R software, version 4.2.2, Adobe, version 26.0).Figure 7. Molecular subtypes of breast cancer identified by consensus clustering analysis. (A) The consensus score matrix of all samples when k=2 in the TCGA-TGCT cohort. (B) The corresponding relative change in area under the cumulative distribution function (CDF) curves when cluster number changes from k to k+1. (C) K-M survival analysis of the TRGs-derived subtypes in the TGCA-BRCA cohort. (D) Comparison of the risk scores between the cluster 1 and cluster 2. (R software, version 4.2.2, Adobe, version 26.0).Figure 8. Immune infiltration and chemosensitivity among molecular subtypes derived from TRGs. (A) Comparison of the chemosensitivities between cluster 1 and cluster 2 to drugs. (B) comparison of the cell composition of 22 immune cells between cluster1 and cluster 2. (C) Comparison of 4 types of immune cells between cluster 1 and cluster 2. (R software, version 4.2.2, Adobe, version 26.0).Figure 9. Construction and validation a nomogram for predicting OS of BC. (A) A nomogram comprising of 4 factors including age, radiotherapy, N stage, and TRGs-based risk model. (B) The calibration curve of the nomogram. (C) DCA curves of the nomogram and various signal predictor. (R software, version 4.2.2, Adobe, version 26.0). In Press
06 Mar 2024 : Clinical Research
Comparison of Outcomes between Single-Level and Double-Level Corpectomy in Thoracolumbar Reconstruction: A ...Med Sci Monit In Press; DOI: 10.12659/MSM.943797
21 Mar 2024 : Meta-Analysis
Economic Evaluation of COVID-19 Screening Tests and Surveillance Strategies in Low-Income, Middle-Income, a...Med Sci Monit In Press; DOI: 10.12659/MSM.943863
10 Apr 2024 : Clinical Research
Predicting Acute Cardiovascular Complications in COVID-19: Insights from a Specialized Cardiac Referral Dep...Med Sci Monit In Press; DOI: 10.12659/MSM.942612
06 Mar 2024 : Clinical Research
Enhanced Surgical Outcomes of Popliteal Cyst Excision: A Retrospective Study Comparing Arthroscopic Debride...Med Sci Monit In Press; DOI: 10.12659/MSM.941102
Most Viewed Current Articles
17 Jan 2024 : Review article
Vaccination Guidelines for Pregnant Women: Addressing COVID-19 and the Omicron VariantDOI :10.12659/MSM.942799
Med Sci Monit 2024; 30:e942799
14 Dec 2022 : Clinical Research
Prevalence and Variability of Allergen-Specific Immunoglobulin E in Patients with Elevated Tryptase LevelsDOI :10.12659/MSM.937990
Med Sci Monit 2022; 28:e937990
16 May 2023 : Clinical Research
Electrophysiological Testing for an Auditory Processing Disorder and Reading Performance in 54 School Stude...DOI :10.12659/MSM.940387
Med Sci Monit 2023; 29:e940387
01 Jan 2022 : Editorial
Editorial: Current Status of Oral Antiviral Drug Treatments for SARS-CoV-2 Infection in Non-Hospitalized Pa...DOI :10.12659/MSM.935952
Med Sci Monit 2022; 28:e935952