13 June 2023: Clinical Research
Comparison of Texture and Color Enhancement Imaging with White Light Imaging in 52 Patients with Short-Segment Barrett’s Esophagus
Atsushi Ikeda1BCDEF, Tsutomu TakedaDOI: 10.12659/MSM.940249
Med Sci Monit 2023; 29:e940249


Abstract
BACKGROUND: Texture and color enhancement imaging (TXI), a new type of image-enhanced endoscopy, may improve the detection of gastrointestinal lesions. Barrett’s esophagus (BE) requires an accurate diagnosis since it may undergo neoplastic transformation. We aimed to evaluate the usefulness of TXI compared with white light imaging (WLI) in BE.
MATERIAL AND METHODS: In this prospective study at a single hospital from February 2021 to February 2022, we enrolled 52 consecutive patients with BE. Endoscopic images of BE using WLI, TXI mode 1 (TXI-1), TXI mode 2 (TXI-2), and narrow-band imaging (NBI) were compared by 10 endoscopists (5 experts and 5 trainees). Endoscopists scored visibility for the images as follows: 5 (improved), 4 (somewhat improved), 3 (equivalent), 2 (somewhat decreased), and 1 (decreased). Total visibility scores for all 10 endoscopists, and subgroups composed of the 5 expert endoscopists and the 5 trainee endoscopists, were evaluated. Main-group (10 endoscopists) scores of ≥40, 21-39, and ≤20, and subgroup (5 endoscopists) scores of ≥20, 11-19, and ≤10, were considered “improved”, “equivalent”, and “decreased”, respectively. Inter-rater reliability (intra-class correlation coefficient [ICC]) was calculated and images were objectively assessed based on L*a*b* color values and color differences (ΔE*).
RESULTS: All 52 cases were diagnosed as short-segment BE (SSBE). TXI-1/TXI-2 improved visibility compared with WLI was: 78.8%/32.7% for all endoscopists; 82.7%/40.4% for trainees; and 76.9%/34.6% for experts. NBI did not improve visibility. The ICC for TXI-1 and TXI-2 compared with WLI was “excellent” for all endoscopists. The ΔE* between esophageal and Barrett’s mucosae, and between Barrett’s and gastric mucosae, was higher for TXI-1 than for WLI (P<0.01, P<0.05, respectively).
CONCLUSIONS: TXI, especially TXI-1, improves the endoscopic diagnosis of SSBE compared with WLI, regardless of the endoscopist’s skill.
Keywords: Barrett Esophagus, Endoscopy, Digestive System, endoscopy, esophageal mucosa, Endoscopy, Gastrointestinal, Humans, Prospective Studies, Reproducibility of Results, Cell Transformation, Neoplastic, Image Enhancement
Background
Because the prevalence of gastroesophageal reflux disease (GERD) is increasing within the general population, the frequencies of both Barrett’s esophagus (BE) and esophageal adenocarcinoma are also rising [1]. In Japan, we expect incidences of BE and esophageal adenocarcinoma to rise due to increasing rates of obesity, GERD, lifestyle changes, and decreasing
In recent years, image-enhanced endoscopy (IEE) has been attracting much attention for its usefulness in the diagnosis of many kinds of gastroenterological lesions. Various IEEs, such as texture and color enhancement imaging (TXI) [11–18], flexible spectral imaging [19], iScan [20], narrow-band imaging (NBI), linked color imaging (LCI) [21–26], and blue laser imaging [27], have been developed and widely applied in clinical practice. TXI (Olympus Medical Systems Corporation, Tokyo, Japan), which has recently been developed for IEE, facilitates the identification of differences in mucosal color and structure [28]. As an imaging technology, TXI optimizes 3 elements: structure (texture) enhancement, color tone, and brightness correction. WLI is divided into a texture component and a base component that includes brightness. The images of each component are then properly processed and synthesized as TXI mode 2 (TXI-2). The image that precedes the color tone enhancement that is included in TXI-2 is the TXI mode 1 (TXI-1). This makes it easier to recognize structural changes and slight color changes in the image and support the detection of lesions. Recently, the usefulness of TXI has been described in studies of esophageal neoplasm, mucosal atrophy, gastric neoplasm, gastric cancer, colorectal neoplasm, and ulcerative colitis [11–18]. As another IEE, LCI (Fujifilm Corporation, Tokyo, Japan) has highlighted the utility of observation in the esophagogastric junction area. The usefulness of LCI in BE, reflux esophagitis, and Barrett’s neoplasia has been reported [21–26]. Therefore, this study aimed to compare TXI with WLI in 52 patients with SSBE by assessing the performance of trainee and expert endoscopists in this regard, and to evaluate the usefulness of TXI in the diagnosis of SSBE.
Material and Methods
ETHICS STATEMENT:
The ethics committee of Juntendo University Hospital (No. 20-347) approved the study, which was performed according to the tenets of the Declaration of Helsinki. All patients provided written, informed consent to participate in this study. This study is registered with the University Hospital Medical Research Network (#UMIN000045323).
PATIENT SELECTION:
In a single-center prospective clinical study, we investigated whether the visibility of BE increased when using TXI compared with WLI. Consecutive patients were enrolled who experienced esophagogastroduodenoscopy with WLI, TXI, and NBI between February 2021 and February 2022 at our hospital. Patients underwent endoscopy for various reasons, including GERD symptoms, medical check-ups, anemia, abdominal pain, and as a part of followup after having gastric ulcers. Patients were excluded if the gastroesophageal junction (GE-J) was found not to be fully extended. Additionally, patients were excluded if they had a history of esophageal surgery or gastrectomy, or advanced gastric or esophageal cancers, as well as those for whom endoscopy would be difficult because of serious primary diseases such as heart, hepatic, or respiratory failures.
ESOPHAGOGASTRODUODENOSCOPY PROCEDURE:
GIF-H290Z and GIF-XZ1200 endoscopes, and an EVIS X1 Video System Center OLYMPUS CV-1500, were used (Olympus Medical Systems Corporation, Tokyo, Japan). Expert endoscopists (YA, TT, HU) performed all endoscopic examinations. Most patients were outpatients. Patients were awake, with or without mild sedation with midazolam, and able to follow the examiner’s instructions during endoscopic examinations. The GE-J was recorded during the air inspiration phase, and the images were recorded closely enough to observe the squamocolumnar junction (SC-J) in full circumferential view. Three expert endoscopists (YA, TT, HU) assessed and discussed WLI images until a consensus view was reached for each endoscopic finding. All images were obtained from the server in JPEG format without a loss of image quality. Each image had a file size of about 100 kB, a pixel array of 640×510, and 24-bit color.
DEFINITION OF BARRETT’S ESOPHAGUS:
ESEM was diagnosed if an endoscopy finding was consistent with BE pending confirmation by histological examination. In Japan, a GE-J is defined as the distal end of the lower esophageal palisade vessels [29]. In contrast, in Western countries, a GE-J is determined as being present at the proximal end of the gastric folds (Prague C & M criteria) [30]; in the present study, the former definition for a GE-J was used. However, when palisade vessels were undetectable, the position of a GE-J was defined as the proximal end of the gastric folds. An ESEM was defined as being in the area between the GE-J and SC-J [8]. LSBE was defined as BE extending more than 3 cm circumferentially from the GE-J and SSBE was defined as BE that did not meet the criteria for LSBE.
EVALUATION OF OTHER ENDOSCOPIC FINDINGS:
The classification of atrophic gastritis was done according to the classification system of Kimura and Takemoto, and was described as either closed (C 1–3) or open (O 1–3) [31]. The classification of reflux esophagitis was done according to the Los Angeles (LA) classification system [32]. The description of non-erosive reflux esophagitis was according to a modified LA classification system [33,34]. A hiatus hernia was defined as an apparent separation of the esophagogastric junction and diaphragm by >2 cm.
:
A positive result from a 13C-urea breath test and/or the detection of anti-
EVALUATION OF VISIBILITY OF BARRETT’S ESOPHAGUS:
Ten endoscopists (5 expert raters: HU, TT, YA, NY, and AI; and 5 trainee raters: SO, NS, DA, RU, and TI) compared WLI with TXI-1, TXI-2, and NBI using 52 sets of images, with an image obtained from each of the 52 patients. Experts were defined as board-certified gastroenterologists of the Japan Gastroenterological Endoscopy Society, and had at least 5 years’ experience in endoscopy and prior experience with the TXI system. Trainees were not certified and had less than 5 years’ experience in endoscopy. The images were independently and randomly displayed to each of the endoscopists against a black background, 10.3×12.9 cm in size, on a screen (Microsoft Office PowerPoint 2019, Microsoft Inc, Redmond, WA, USA). WLI–TXI-1, WLI–TXI-2, or WLI–NBI images were displayed side by side. Raters were shown anonymous images that did not reveal any clinical data or the date of imaging. Visibility was assessed by raters as follows: 5 (improved), 4 (somewhat improved), 3 (equivalent), 2 (somewhat decreased), and 1 (decreased). The scores of all 10 endoscopists were added together, and a total score ≥40 points was defined as showing improved visibility, 21–39 points as being equivalent to WLI, and ≤20 points as indicating decreased visibility. The 5 expert endoscopists and 5 trainee endoscopists analyzed the images, and the total scores for each of these subgroups were compared. Scores were defined as: ≥20 points for improved visibility, 11–19 points for equivalent to white light, and ≤10 points for decreased visibility. In addition, the intra-class correlation coefficient (ICC) was assessed as a measure of inter-rater reliability.
COLOR ANALYSIS:
For objective evaluation, captured images were analyzed and scored based on L* a* b* (L*=light/dark; a*=red/green; b*=yellow/blue) color values in a Commission Internationale de l’Eclairage (CIE) L* a* b* color-space system [35] using Adobe® Photoshop CC 2019 (Adobe Inc., San Jose, CA, USA) according to a previous report [36]. A region of interest (ROI, 40×40 pixels) was set for each of 3 histologically distinct regions: Barrett’s mucosa, normal esophageal mucosa, and normal gastric mucosa. The ROIs were selected at the same position in all 4 images of a particular lesion. A histogram panel was used to calculate the average color values (L, a, b) in an ROI, with L, a, and b designating the color values in a Photoshop Lab color unit. L, a, and b color values were transformed to L*, a*, and b* color values in a CIE L* a* b* as follows; L* = L / 256 × 100, a* = a − 128, b* = b − 128 [37,38]. The visibility of each color image was evaluated from the color difference (ΔE* = [(ΔL*)2 + (Δa*)2 + (Δb*)2]1/2) of the pixel values based on L* a* b* color spaces within the ROI.
STATISTICAL ANALYSIS:
SPSS for Windows, version 28.0 (SPSS, Inc., Chicago, IL, USA) was used for all statistical analyses. A Mann-Whitney U test was used to assess differences in visibility scores between trainees and experts. A Wilcoxon rank sum test was used to assess differences between TXI-1, TXI-2, and NBI for visibility scores. A Student’s
To test for inter-rater reliability, we used ICC with 95% confidence intervals. The ICC is commonly used to assess inter-rater reliability for ordinal, interval, and ratio variables. The ICC is suitable for when 2 or more coders are used in studies [39]. The strength of reliability was defined as “perfect” for an ICC score of 1.0, “excellent” for ≥0.81, “substantial” for 0.80–0.61, “moderate” for 0.60–0.41, “fair” for 0.40–0.21, and “slight” for <0.20 [40,41]. The sample size was made adequate for estimation by using 10 assessors. A minimally acceptable reliability (ρ0) was set at 0.7, and expected reliability (ρ1) was 0.8. Since the sample size to detect this difference at an α error=0.05 and β error=0.2 was 51.5 [42], a total of 52 patients were enrolled in this study.
Results
PATIENT CHARACTERISTICS:
The characteristics of the study participants are shown in Table 1. The mean age was 64.1 years and, out of 52 participants, 25 were male and 27 were female. A hiatus hernia was present in 28.8% (15/52) of participants, and 30.8% (16/52) had reflux esophagitis. Based on Prague C & M criteria, C0M1: (34/52) 65.4% and C1M1: (7/52) 13.5% were mainly observed, and LSBE was not detected.
REPRESENTATIVE CASES OF BARRETT’S ESOPHAGUS:
Figure 1 shows representative endoscopic images captured using WLI, TXI-1, TXI-2, and NBI. SSBE with TXI was identified by enhancing its red appearance, and led to the clear visibility of esophageal palisade vessels. Compared with WLI and NBI, the borderlines of an SC-J and also GE-J were clearly detectable with TXI. In this case (Figure 1), all endoscopists assessed TXI-1 at 46 points and TXI-2 at 43 points (improved visibility), but NBI at 24 points (equivalent visibility). Figure 2 shows representative endoscopic images of cases in which the GE-J was detected by the proximal end of gastric folds because of its invisible palisade vessels. Since the borderlines of the SC-J and GE-J were easily identified by not only WLI but also TXI and NBI, the visibilities of BE were regarded as equivalent (TXI-1: 34 points, TXI-2: 33 points, and NBI: 24 points).
VISIBILITY SCORES:
The visibility scores of experts, trainees, and all endoscopists for TXI and NBI compared with WLI are shown in Table 2. Total visibility scores were as follows: TXI-1: 43.0, TXI-2: 37.5, NBI: 22.0 for all endoscopists; TXI-1: 22.0, TXI-2: 19.0, NBI: 9.0 for trainee endoscopists; and TXI-1: 22.0, TXI-2: 19.0, NBI: 12.0 for expert endoscopists. Total visibility scores for all endoscopists were significantly higher using TXI-1 compared with TXI-2, and significantly higher using both TXI-1 and TXI-2 compared with NBI. The visibility score for trainees did not show any significant difference for either TXI-1 or TXI-2 compared with the score for experts.
EVALUATION OF THE VISIBILITY OF BARRETT’S ESOPHAGUS:
Table 3 shows a comparison of the visibility of TXI and NBI with WLI for each rater group and all endoscopists, respectively. Compared with WLI, improved visibility was achieved for TXI-1 (78.8% [41/52]); TXI-2 (32.7% [17/52]); and NBI (0%), for all endoscopists; TXI-1 (82.7% [43/52]); TXI-2 (40.4% [21/52]); and NBI (0%), for trainees; and TXI-1 (76.9% [40/52]); TXI-2 (34.6% [18/52]); and NBI (0%), for experts. Decreased visibility was not detected for either TXI-1 or TXI-2 but was detected for NBI (30.8% [16/52]) for all participants.
INTER-RATER RELIABILITY:
Table 3 also shows a comparison of the inter-rater reliability of TXI and NBI with WLI for each rater subgroup and all endoscopists, respectively. For a comparison of TXI-1/TXI-2 and WLI, the ICCs for inter-rater reliability were 0.79/0.70 for trainees, 0.76/0.70 for experts, and 0.87/0.81 for all endoscopists. The ICCs for a comparison of NBI and WLI were 0.36 for trainees, 0.27 for experts, and 0.54 for all endoscopists. The inter-rater reliability for TXI-1 and TXI-2 was “substantial” for trainees and experts, and “excellent” for all endoscopists, respectively. The inter-rater reliability for NBI was “fair” for trainees and experts, and “moderate” for all endoscopists.
:
Figure 3 shows representative endoscopic images for an ROI. L* a* b* color values for esophageal (yellow box), Barrett’s (white box), and gastric (blue box) mucosae were calculated. Table 4 shows objective evaluations using L*, a*, and b* color values. Significant differences were noted between WLI and TXI-1 except for a* in Barrett’s mucosa. No significant differences were noted between WLI and TXI-2 except for a* in Barrett’s mucosa. Figure 4 presents a scatter plot of a*b* color values in the CIE L* a* b* color-space system. With WLI, TXI-2, and NBI, some overlap of the color distribution occurred between sites (Figure 4A, 4C, 4D). With TXI-1, however, good color separation as well as less overlap of color distribution were observed (Figure 4B).
OBJECTIVE EVALUATION USING COLOR DIFFERENCE:
Table 5 shows objective evaluations using the color difference (ΔE*) based on the CIE L* a* b* color space. Statistically significant differences were noted between WLI and TXI-1 (P < 0.01), WLI and NBI (P<0.01), and TXI-1 and TXI-2 (P<0.01) for the color difference (ΔE*) between esophageal and Barrett’s mucosae. No significant difference was observed between WLI and TXI-2 (P=0.21). Statistically significant differences were also observed between WLI and TXI-1 (P<0.05), and WLI and NBI (P<0.05) for the ΔE* between Barrett’s and gastric mucosae; no differences were noted between WLI and TXI-2, and between TXI-1 and TXI-2.
Discussion
We conducted a prospective study that compared the usefulness of TXI with WLI in 52 patients with SSBE. We found that TXI-1 and TXI-2, compared with WLI, improved the visibility of SSBE when assessed by trainees, experts, and all endoscopists. For the evaluation of visibility, the inter-rater reliability for TXI-1 and TXI-2, compared with WLI, was “substantial” for trainees and experts, and “excellent” for all endoscopists. Additionally, TXI-1 showed good color separation of the color distribution and statistically significant differences between WLI and TXI-1 for color differences in an objective evaluation with
IEE is used to highlight gastrointestinal lesions. A marked improvement in the visibility of BE has highlighted the usefulness of IEE in recent years. The usefulness of IEE, including TXI [43], flexible spectral imaging [19], iScan [20], NBI [9,44], and LCI [21,24] have been reported in the evaluation of BE.
TXI is a newly developed technique of IEE characterized by a specific texture-, color tone-, and brightness-enhancing function, and has received increasing attention in early gastric and esophageal cancers in the region of the upper gastrointestinal tract [12–15,18].
A retrospective study on the usefulness of TXI and NBI in BE using third-generation high-vision ultrathin endoscopy reported that visibility scoring and color analysis showed TXI and NBI to be useful in diagnosing BE [43]. As a next step following that study, we conducted a prospective study and evaluated the ICC; we found TXI, but not NBI, to be useful for SSBE.
A report evaluating the usefulness of TXI in squamous cell carcinomas suggested that TXI-1 improves the visibility of esophageal squamous cell carcinoma, but did not perform better than NBI [18]. Interestingly, TXI may be useful in improving the visibility of both glandular and squamous epithelium cells.
We previously reported on the usefulness of LCI in BE in a retrospective study [21]. Endoscopic scores and ICCs were calculated and color analysis was also performed. Improved visibility was observed in 55.6%, 47.6%, and 44.4% of cases for trainees, experts, and all endoscopists, respectively. All ICCs were evaluated as moderate or substantial. Compared with the current results, TXI-1, rather than LCI, led to an improvement in the visibility of BE. This may be because LCI is characterized by a specific color-enhancement function, while TXI-1 improves the visibility of BE by clarifying not only color tone but also brightness and structure.
Because blood vessels appeared red and enhanced in TXI, when palisade vessels were visually recognizable, it was thought that visibility was improved. Initially, it was expected that it would be difficult to improve visibility in TXI-2 due to its absence of a color enhancement function. However, improved visibility was found in TXI-2. It was thought that visibility improved because a texture enhancement in TXI-2 made it easier to recognize morphological changes in Barrett’s mucosa and palisade vessels. In addition, TXI-1 had a higher visibility score compared with TXI-2 because color tone enhancement leads to good color separation in BE.
In contrast, NBI did not lead to an improvement in the visibility of BE in our study, even though a previous study with NBI showed this to improve visibility [45]. However, because close-up observations or magnifying endoscopy were used in most of these studies, more detailed observations with this approach may improve visibility. NBI was highly accurate in the detection of dysplasia in BE [46]; it is useful for a precise diagnosis by magnifying endoscopy. In NBI, the color of palisade vessels was rendered in a cyan tone, while the color of the background mucosa was rendered in a brown tone. Therefore, the color difference between palisade vessels and background mucosa was not enhanced because of the color tone and reduced brightness (Table 4). In the future, improved visibility is expected after more detailed observations or with the use of magnified endoscopy.
The ICCs for the inter-rater reliability for TXI-1 and TXI-2 were “excellent” for all endoscopists. Combined with the results of improved visibility and excellent inter-rater reliability, TXI was useful compared with WLI. In comparison, the inter-rater reliability for NBI was “fair” for trainees and experts, and “moderate” for all endoscopists. Curvers et al [47] showed that for mucosal morphology, the inter-rater reliability of magnified NBI observations of BE was associated with a moderate to substantial improvement of visibility; this indicated that magnified observation using NBI may improve the inter-rater reliability for this imaging modality.
The
In conclusion, TXI, especially TXI-1, improves the visibility of SSBE compared with WLI when assessed by both trainees and experts due to better contrasting images of both the SC-J and GE-J, and better detection of palisade vessels. The inter-rater reliability of TXI compared with WLI was “substantial” for trainees and experts, and “excellent” for all endoscopists. Additionally, our results indicate that using TXI will lead to an improvement in the diagnosis of BE in the future.
Several limitations were associated with our study. First, we enrolled a small number of patients from only a single center. Second, because visibility was assessed subjectively, this may have led to observer bias. We therefore undertook an objective quantitative analysis with color differences for each image. Third, any association between the histological diagnosis of Barrett’s mucosa and visibility was not elucidated because we aimed at a diagnosis of ESEM in this study. Finally, we examined visibility, not detectability, in images in daily practice. The results of this study do not necessarily indicate the usefulness of TXI in actual clinical practice. Therefore, a larger patient cohort, further histological analyses, and randomized controlled examinations are required in future studies to confirm our results.
Conclusions
TXI, especially TXI-1, improves the endoscopic diagnosis of SSBE compared with using WLI, regardless of the endoscopist’s skill, by improving the contrast of both the SC-J and GE-J and the visibility of palisade vessels.
Figures
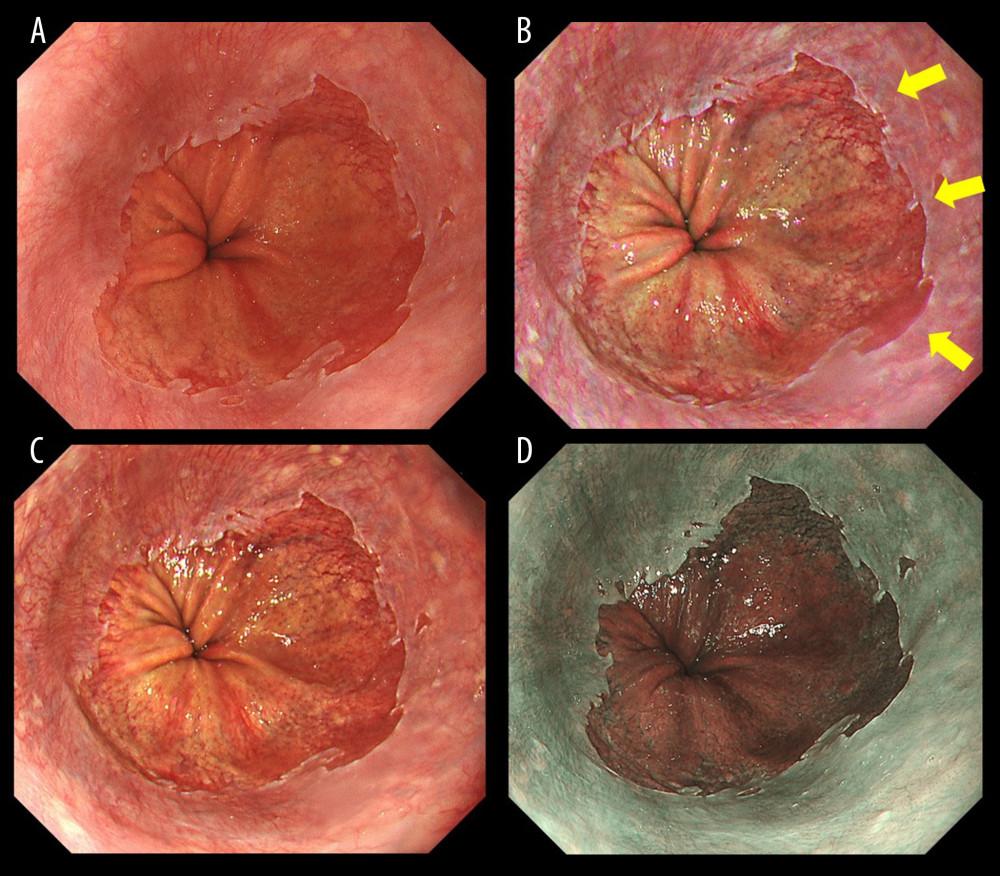 Figure 1. Endoscopic images of a representative case in which the gastroesophageal junction was detected based on the visibility of palisade vessels. (A) White light imaging (WLI). Barrett’s mucosa existed non-circumferentially in the lower esophagus and extended upwards for approximately 1 cm; this was diagnosed as short-segment Barrett’s esophagus (SSBE, Prague Classification: C0M1). (B) Texture and color enhancement imaging mode 1 (TXI-1). Yellow arrows indicate SSBE, which is emphasized in a red color, and palisade vessels. The gastroesophageal junction (GE-J) was easily detected by the distal end of lower esophageal palisade vessels. (C) Texture and color enhancement imaging mode 2 (TXI-2). SSBE is emphasized with TXI-2. (D) Narrow-band imaging (NBI). The visibility of palisade vessels was decreased.
 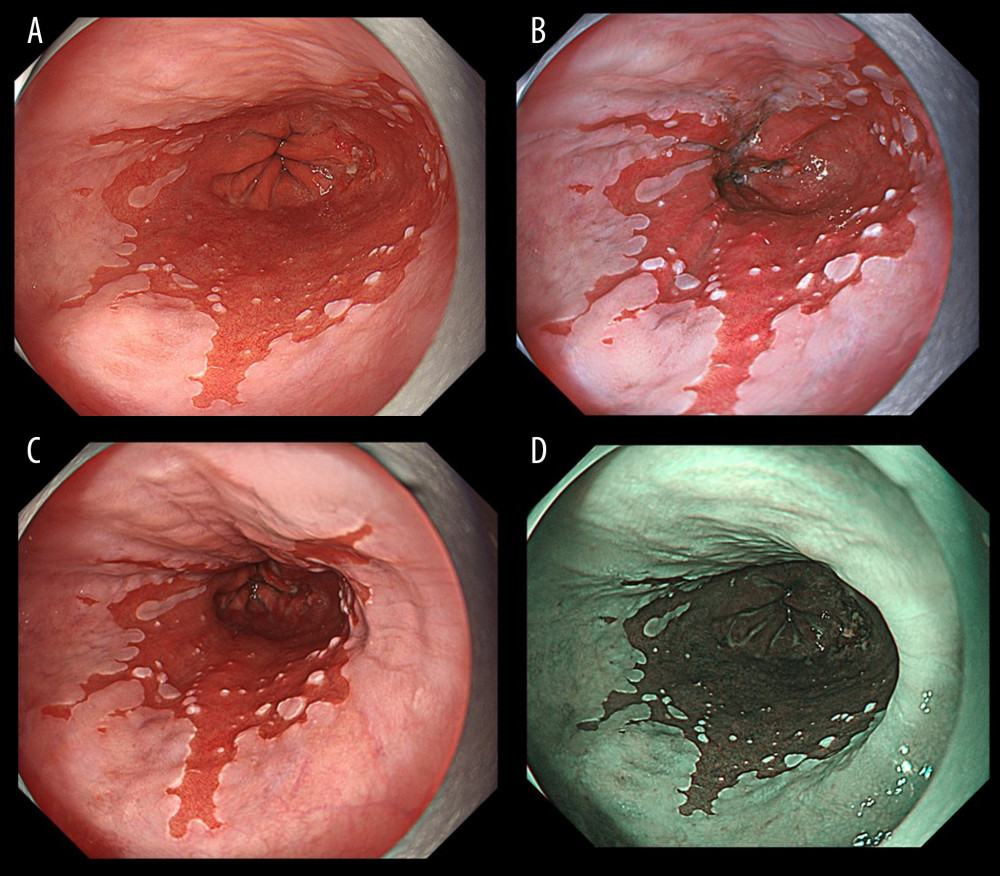 Figure 2. Endoscopic images of a representative case in which the gastroesophageal junction was detected due to the visibility of the proximal end of the gastric folds. (A) White light imaging (WLI). Barrett’s mucosa existed approximately 1 cm circumferentially and 3 cm in maximum length in the lower esophagus; this was diagnosed as short-segment Barrett’s esophagus (SSBE, Prague Classification: C1M3). In this case, the palisade vessels were invisible and the gastroesophageal junction (GE-J) was detected by the proximal end of the gastric folds. (B) Texture and color enhancement imaging mode 1 (TXI-1). (C) Texture and color enhancement imaging mode 2 (TXI-2). (D) Narrow-band imaging (NBI).
 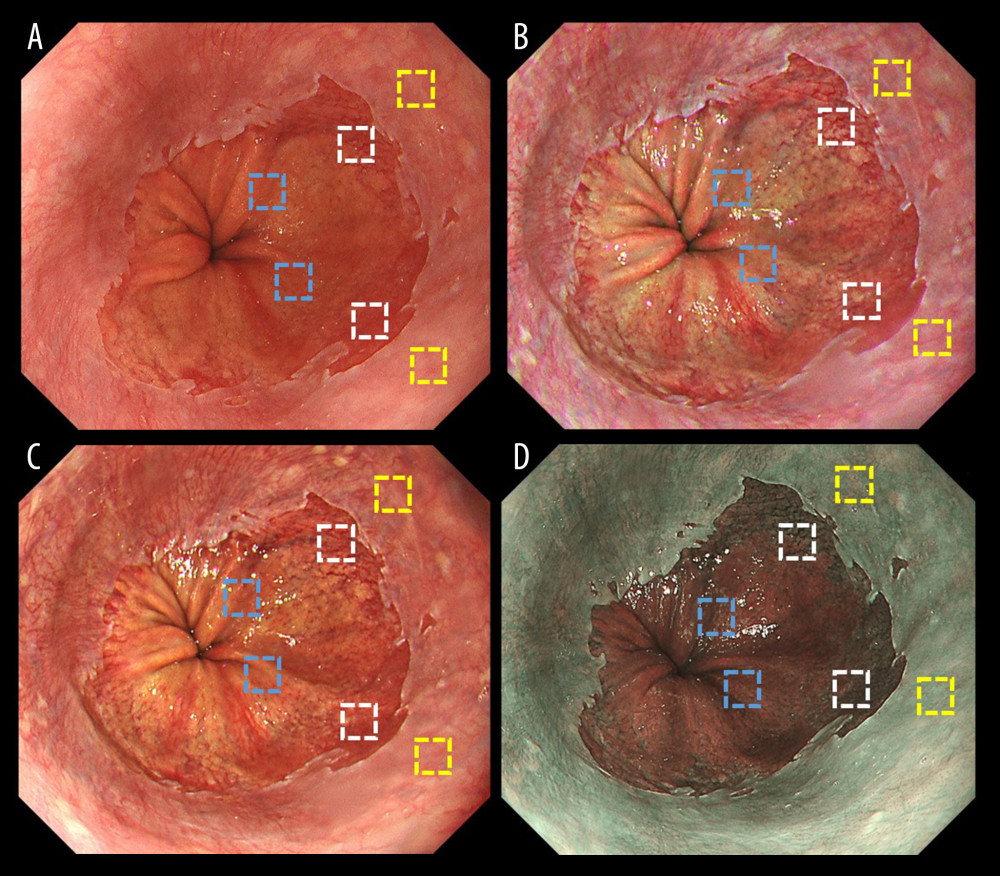 Figure 3. Representative endoscopic images using (A) white light imaging (WLI), (B) texture and color enhancement imaging mode 1 (TXI-1), (C) texture and color enhancement imaging mode 2 (TXI-2), and (D) narrow-band imaging (NBI) with the region of interest (ROI, 40×40 pixels). ROIs were set in the esophageal mucosa (yellow box), Barrett’s esophagus (white box), and gastric mucosa (blue box), and the same positions in all 3 images of a particular lesion were selected.
 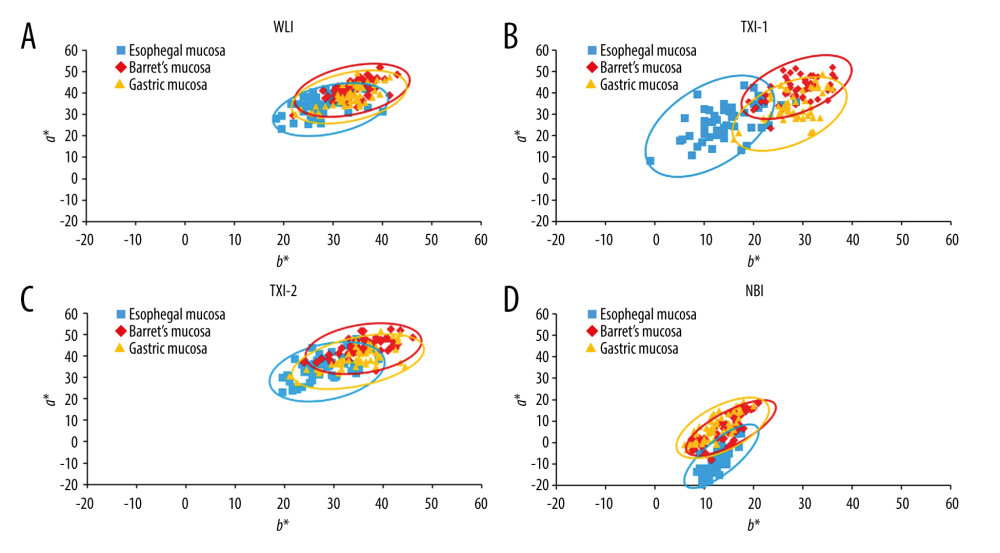 Figure 4. Scatter plot of a*b* color values in the Commission Internationale de l’Eclairage (CIE) L* a* b* color-space system. The blue squares enclosed by blue ellipses represent esophageal mucosa. The red rhombuses enclosed by red ellipses represent Barrett’s esophagus. The orange triangles enclosed by orange ellipses represent gastric mucosa. (A) White light imaging (WLI). There is some overlap between each site. (B) Texture and color enhancement imaging mode 1 (TXI-1). Good color separation and less overlap between each site are apparent compared with WLI, texture and color enhancement imaging mode 2 (TXI-2), and narrow-band imaging (NBI). (C) TXI-2. Some overlap is apparent between each site. (D) Narrow-band imaging (NBI). Some overlap is apparent between each site.
 Tables
Table 1. Characteristics and endoscopic findings for all 52 patients.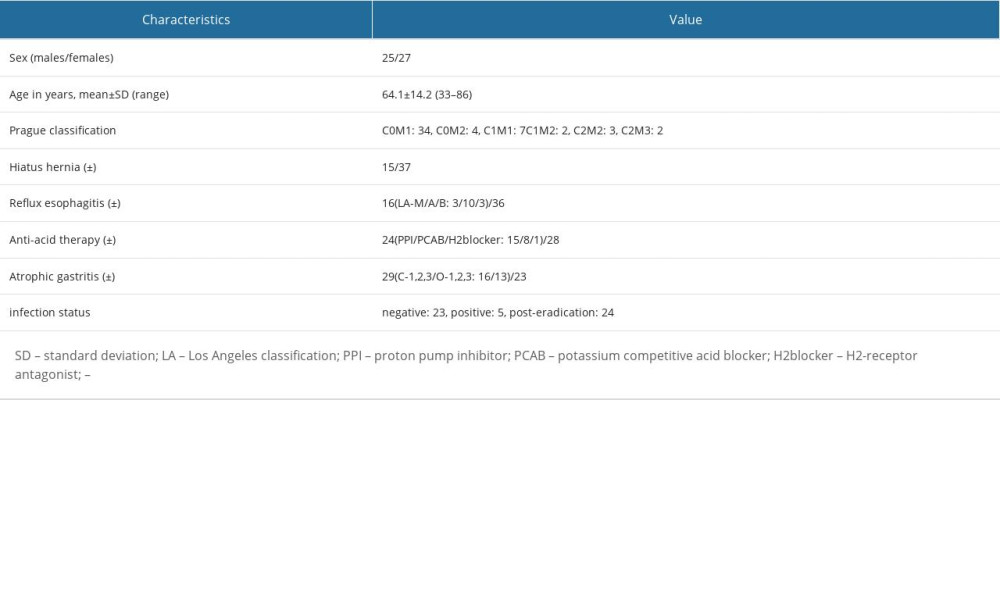 Table 2. Visibility scores for trainees, experts, and all endoscopists, and comparison of visibility scores of all endoscopists.
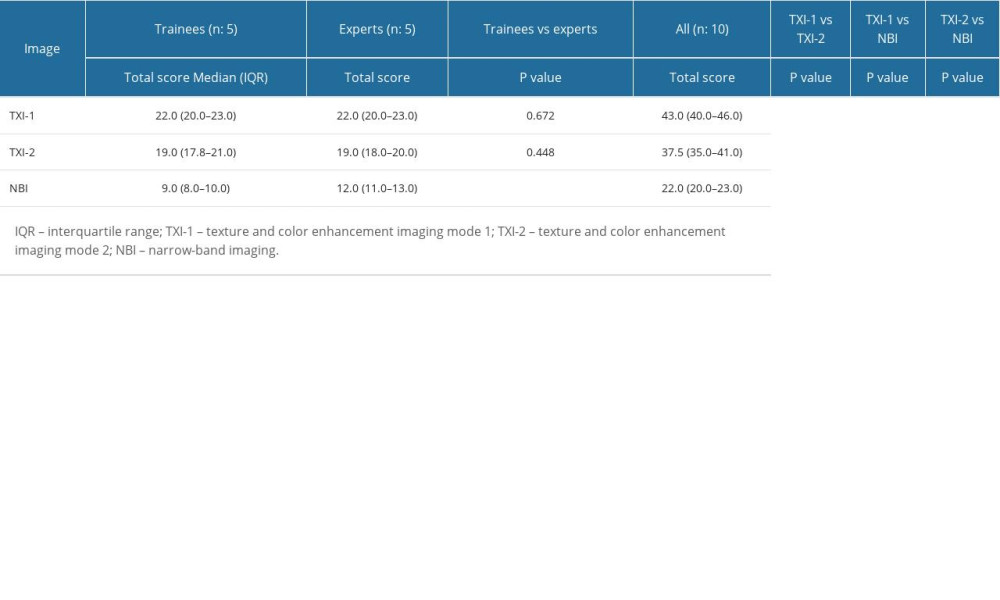 Table 3. Evaluation of TXI-1, TXI-2, and NBI for the visibility of SSBE and inter-rater reliability of trainees, experts, and all endoscopists (n=52).
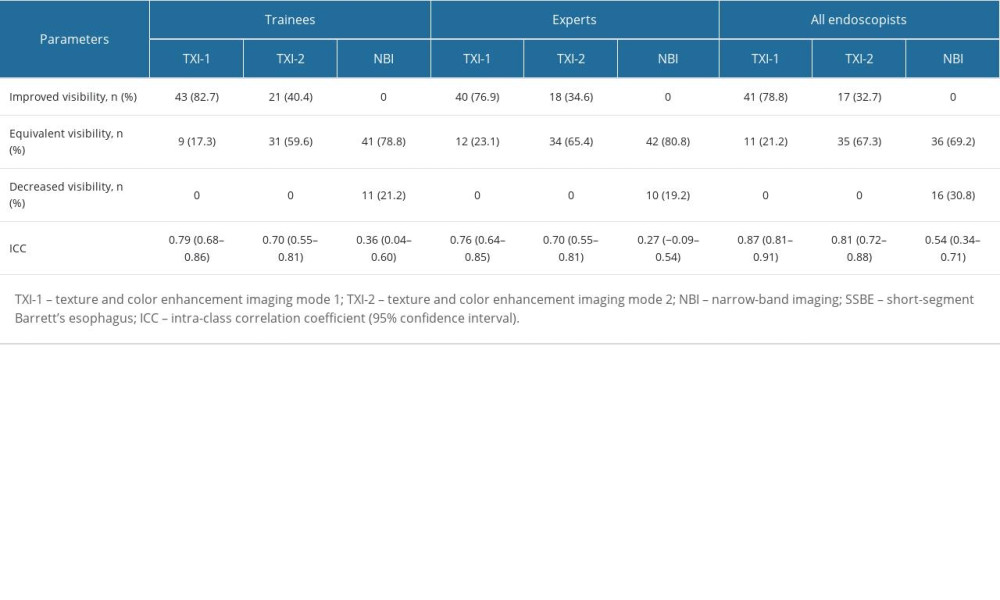 Table 4. Objective evaluations using L*, a*, and b* color values and comparison of values in WLI, TXI-1, TXI-2, and NBI (mean±SD).
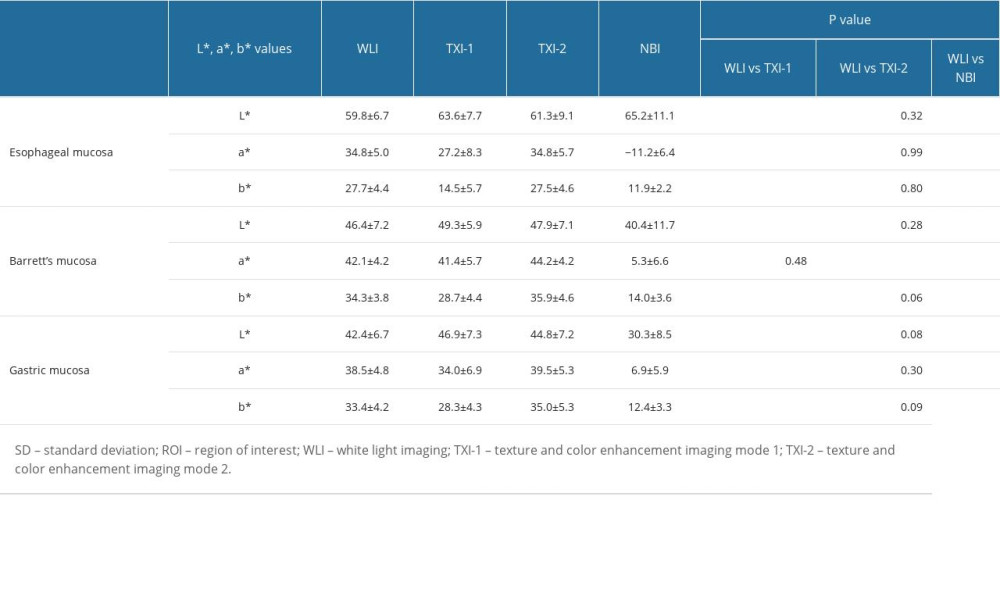 Table 5. Color differences (mean±SD) in the CIE L* a* b* color-space system between ROIs and comparisons of values in each imaging mode.
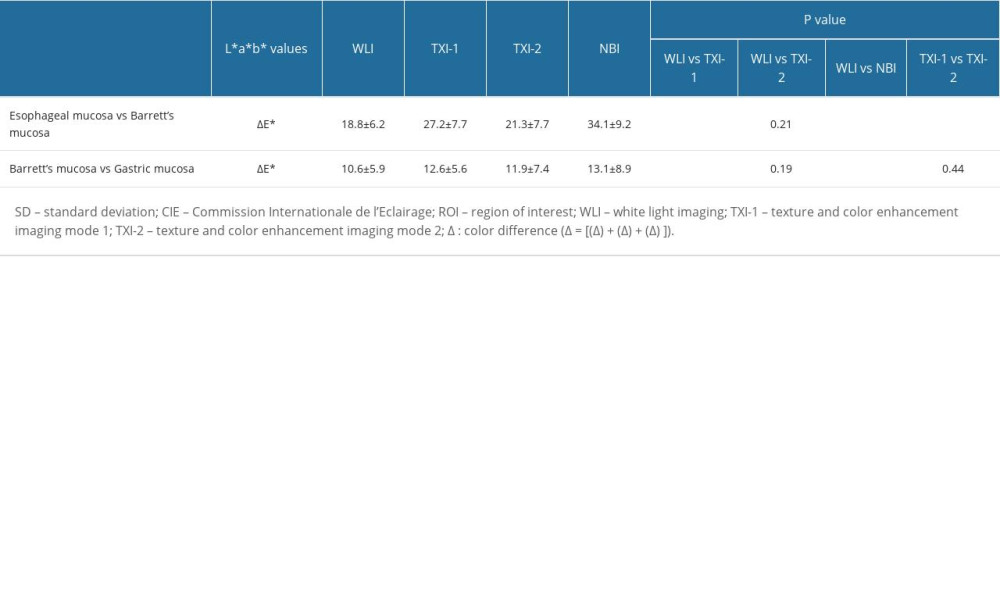
References
1. Pera M, Cameron AJ, Trastek VF, Increasing incidence of adenocarcinoma of the esophagus and esophagogastric junction: Gastroenterology, 1993; 104(2); 510-13
2. Kusano C, Gotoda T, Khor CJ, Changing trends in the proportion of adenocarcinoma of the esophagogastric junction in a large tertiary referral center in Japan: J Gastroenterol Hepatol, 2008; 23(11); 1662-65
3. Koike T, Saito M, Ohara Y, Current status of surveillance for Barrett’s esophagus in Japan and the West: DEN Open, 2022; 2(1); e94
4. Chang CY, Cook MB, Lee YC, Current status of Barrett’s esophagus research in Asia: J Gastroenterol Hepatol, 2011; 26(2); 240-46
5. Cameron AJ, Epidemiology of Barrett’s esophagus and adenocarcinoma: Dis Esophagus, 2002; 15(2); 106-8
6. Chandrasekar VT, Hamade N, Desai M, Significantly lower annual rates of neoplastic progression in short- compared to long-segment non-dysplastic Barrett’s esophagus: A systematic review and meta-analysis: Endoscopy, 2019; 51(7); 665-72
7. Norita K, Koike T, Saito M, Long-term endoscopic surveillance for Barrett’s esophagus in Japan: Multicenter prospective cohort study: Dig Endosc, 2021; 33(7); 1085-92
8. Vakil N, van Zanten SV, Kahrilas P, The Montreal definition and classification of gastroesophageal reflux disease: A global evidence-based consensus: Am J Gastroenterol, 2006; 101(8); 1900-20 quiz 1943
9. Sharma P, Weston AP, Topalovski M, Magnification chromoendoscopy for the detection of intestinal metaplasia and dysplasia in Barrett’s oesophagus: Gut, 2003; 52(1); 24-27
10. Endo T, Awakawa T, Takahashi H, Classification of Barrett’s epithelium by magnifying endoscopy: Gastrointest Endosc, 2002; 55(6); 641-47
11. Abe S, Makiguchi ME, Nonaka S, Emerging texture and color enhancement imaging in early gastric cancer: Dig Endosc, 2022; 34(4); 714-20
12. Sugimoto M, Kawai Y, Morino Y, Efficacy of high-vision transnasal endoscopy using texture and colour enhancement imaging and narrow-band imaging to evaluate gastritis: A randomized controlled trial: Ann Med, 2022; 54(1); 1004-13
13. Abe S, Yamazaki T, Hisada IT, Visibility of early gastric cancer in texture and color enhancement imaging: DEN Open, 2022; 2(1); e46
14. Ishikawa T, Matsumura T, Okimoto K, Efficacy of Texture and Color Enhancement Imaging in visualizing gastric mucosal atrophy and gastric neoplasms: Sci Rep, 2021; 11(1); 6910
15. Kawasaki A, Yoshida N, Nakanishi H, Usefulness of third-generation narrow band imaging and texture and color enhancement imaging in improving visibility of superficial early gastric cancer: A study using color difference: DEN Open, 2022; 3(1); e186
16. Hayashi Y, Takabayashi K, Kato M, Usefulness of Texture and Color Enhancement Imaging (TXI) in assessing mucosal healing in patients with ulcerative colitis: Gastrointest Endosc, 2023; 97(4); 759-66e1
17. Sakamoto T, Ikematsu H, Tamai N, Detection of colorectal adenomas with texture and color enhancement imaging: Multicenter observational study: Dig Endosc, 2023; 35(4); 529-37
18. Dobashi A, Ono S, Furuhashi H, Texture and Color Enhancement Imaging increases color changes and improves visibility for squamous cell carcinoma suspicious lesions in the pharynx and esophagus: Diagnostics (Basel), 2021; 11(11); 1971
19. Osawa H, Yamamoto H, Yamada N, Diagnosis of endoscopic Barrett’s esophagus by transnasal flexible spectral imaging color enhancement: J Gastroenterol, 2009; 44(11); 1125-32
20. Everson MA, Lovat LB, Graham DG, Virtual chromoendoscopy by using optical enhancement improves the detection of Barrett’s esophagus-associated neoplasia: Gastrointest Endosc, 2019; 89(2); 247-56e4
21. Takeda T, Nagahara A, Ishizuka K, Improved visibility of Barrett’s esophagus with linked color imaging: Inter- and intra-rater reliability and quantitative analysis: Digestion, 2018; 97(2); 183-94
22. Takeda T, Asaoka D, Abe D, Linked color imaging improves visibility of reflux esophagitis: BMC Gastroenterol, 2020; 20(1); 356
23. de Groof AJ, Fockens KN, Struyvenberg MR, Blue-light imaging and linked-color imaging improve visualization of Barrett’s neoplasia by nonexpert endoscopists: Gastrointest Endosc, 2020; 91(5); 1050-57
24. Tokunaga M, Matsumura T, Ishikawa K, The efficacy of linked color imaging in the endoscopic diagnosis of Barrett’s esophagus and esophageal adenocarcinoma: Gastroenterol Res Pract, 2020; 2020; 9604345
25. Saito M, Koike T, Ohara Y, Linked-color imaging may help improve the visibility of superficial Barrett’s esophageal adenocarcinoma by increasing the color difference: Intern Med, 2021; 60(21); 3351-58
26. Adachi K, Ishimura N, Kishi K: Intern Med, 2021; 60(5); 667-74
27. Yoshida N, Hisabe T, Inada Y, The ability of a novel blue laser imaging system for the diagnosis of invasion depth of colorectal neoplasms: J Gastroenterol, 2014; 49(1); 73-80
28. Sato T, TXI: Texture and Color Enhancement Imaging for endoscopic image enhancement: J Healthc Eng, 2021; 2021; 5518948
29. Kinjo T, Kusano C, Oda I, Gotoda T, Prague C&M and Japanese criteria: Shades of Barrett’s esophagus endoscopic diagnosis: J Gastroenterol, 2010; 45(10); 1039-44
30. Sharma P, Dent J, Armstrong D, The development and validation of an endoscopic grading system for Barrett’s esophagus: The Prague C & M criteria: Gastroenterology, 2006; 131(5); 1392-99
31. Kimura K, Takemoto T, An endoscopic recognition of the atrophic border and its significance in chronic gastritis: Endoscopy, 1969; 1(3); 87-97
32. Lundell LR, Dent J, Bennett JR, Endoscopic assessment of oesophagitis: Clinical and functional correlates and further validation of the Los Angeles classification: Gut, 1999; 45(2); 172-80
33. Hongo M, Minimal changes in reflux esophagitis: Red ones and white ones: J Gastroenterol, 2006; 41(2); 95-99
34. Hoshihara Y, Hashimoto MEndoscopic classification of reflux esophagitis: Nippon Rinsho, 2000; 58(9); 1808-12 [in Japanese]
35. Kuehni RG, Color-tolerance data and the tentative CIE 1976 L a b formula: J Opt Soc Am, 1976; 66(5); 497-500
36. Dohi O, Yagi N, Wada T, Recognition of endoscopic diagnosis in differentiated-type early gastric cancer by flexible spectral imaging color enhancement with indigo carmine: Digestion, 2012; 86(2); 161-70
37. Sommers M, Beacham B, Baker R, Fargo J, Intra- and inter-rater reliability of digital image analysis for skin color measurement: Skin Res Technol, 2013; 19(4); 484-91
38. Tomie A, Dohi O, Yagi N, Blue laser imaging-bright improves endoscopic recognition of superficial esophageal squamous cell carcinoma: Gastroenterol Res Pract, 2016; 2016; 6140854
39. Hallgren KA, Computing inter-rater reliability for observational data: An overview and tutorial: Tutor Quant Methods Psychol, 2012; 8(1); 23-34
40. Fleiss J, Cohen J, The equivalence of weighted kappa and the intraclass correlation coefficient as measures of reliability: Educational and Psychological Measurement, 1973; 33; 613-19
41. Landis JR, Koch GG, The measurement of observer agreement for categorical data: Biometrics, 1977; 33(1); 159-74
42. Walter SD, Eliasziw M, Donner A, Sample size and optimal designs for reliability studies: Stat Med, 1998; 17(1); 101-10
43. Sugimoto M, Kawai Y, Akimoto Y, Third-generation high-vision ultrathin endoscopy using Texture and Color Enhancement Imaging and narrow-band imaging to evaluate Barrett’s esophagus: Diagnostics (Basel), 2022; 12(12); 3149
44. Kato M, Goda K, Shimizu Y, Image assessment of Barrett’s esophagus using the simplified narrow band imaging classification: J Gastroenterol, 2017; 52(4); 466-75
45. Hamamoto Y, Endo T, Nosho K, Usefulness of narrow-band imaging endoscopy for diagnosis of Barrett’s esophagus: J Gastroenterol, 2004; 39(1); 14-20
46. Hajelssedig OE, Zorron Cheng Tao Pu L, Thompson JY, Diagnostic accuracy of narrow-band imaging endoscopy with targeted biopsies compared with standard endoscopy with random biopsies in patients with Barrett’s esophagus: A systematic review and meta-analysis: J Gastroenterol Hepatol, 2021; 36(10); 2659-71
47. Curvers WL, Bohmer CJ, Mallant-Hent RC, Mucosal morphology in Barrett’s esophagus: Interobserver agreement and role of narrow band imaging: Endoscopy, 2008; 40(10); 799-805
Figures
Figure 1. Endoscopic images of a representative case in which the gastroesophageal junction was detected based on the visibility of palisade vessels. (A) White light imaging (WLI). Barrett’s mucosa existed non-circumferentially in the lower esophagus and extended upwards for approximately 1 cm; this was diagnosed as short-segment Barrett’s esophagus (SSBE, Prague Classification: C0M1). (B) Texture and color enhancement imaging mode 1 (TXI-1). Yellow arrows indicate SSBE, which is emphasized in a red color, and palisade vessels. The gastroesophageal junction (GE-J) was easily detected by the distal end of lower esophageal palisade vessels. (C) Texture and color enhancement imaging mode 2 (TXI-2). SSBE is emphasized with TXI-2. (D) Narrow-band imaging (NBI). The visibility of palisade vessels was decreased.Figure 2. Endoscopic images of a representative case in which the gastroesophageal junction was detected due to the visibility of the proximal end of the gastric folds. (A) White light imaging (WLI). Barrett’s mucosa existed approximately 1 cm circumferentially and 3 cm in maximum length in the lower esophagus; this was diagnosed as short-segment Barrett’s esophagus (SSBE, Prague Classification: C1M3). In this case, the palisade vessels were invisible and the gastroesophageal junction (GE-J) was detected by the proximal end of the gastric folds. (B) Texture and color enhancement imaging mode 1 (TXI-1). (C) Texture and color enhancement imaging mode 2 (TXI-2). (D) Narrow-band imaging (NBI).Figure 3. Representative endoscopic images using (A) white light imaging (WLI), (B) texture and color enhancement imaging mode 1 (TXI-1), (C) texture and color enhancement imaging mode 2 (TXI-2), and (D) narrow-band imaging (NBI) with the region of interest (ROI, 40×40 pixels). ROIs were set in the esophageal mucosa (yellow box), Barrett’s esophagus (white box), and gastric mucosa (blue box), and the same positions in all 3 images of a particular lesion were selected.Figure 4. Scatter plot of a*b* color values in the Commission Internationale de l’Eclairage (CIE) L* a* b* color-space system. The blue squares enclosed by blue ellipses represent esophageal mucosa. The red rhombuses enclosed by red ellipses represent Barrett’s esophagus. The orange triangles enclosed by orange ellipses represent gastric mucosa. (A) White light imaging (WLI). There is some overlap between each site. (B) Texture and color enhancement imaging mode 1 (TXI-1). Good color separation and less overlap between each site are apparent compared with WLI, texture and color enhancement imaging mode 2 (TXI-2), and narrow-band imaging (NBI). (C) TXI-2. Some overlap is apparent between each site. (D) Narrow-band imaging (NBI). Some overlap is apparent between each site. Tables
Table 1. Characteristics and endoscopic findings for all 52 patients.Table 2. Visibility scores for trainees, experts, and all endoscopists, and comparison of visibility scores of all endoscopists.Table 3. Evaluation of TXI-1, TXI-2, and NBI for the visibility of SSBE and inter-rater reliability of trainees, experts, and all endoscopists (n=52).Table 4. Objective evaluations using L*, a*, and b* color values and comparison of values in WLI, TXI-1, TXI-2, and NBI (mean±SD).Table 5. Color differences (mean±SD) in the CIE L* a* b* color-space system between ROIs and comparisons of values in each imaging mode.Table 1. Characteristics and endoscopic findings for all 52 patients.Table 2. Visibility scores for trainees, experts, and all endoscopists, and comparison of visibility scores of all endoscopists.Table 3. Evaluation of TXI-1, TXI-2, and NBI for the visibility of SSBE and inter-rater reliability of trainees, experts, and all endoscopists (n=52).Table 4. Objective evaluations using L*, a*, and b* color values and comparison of values in WLI, TXI-1, TXI-2, and NBI (mean±SD).Table 5. Color differences (mean±SD) in the CIE L* a* b* color-space system between ROIs and comparisons of values in each imaging mode. In Press
08 Mar 2024 : Clinical Research
Evaluation of Foot Structure in Preschool Children Based on Body MassMed Sci Monit In Press; DOI: 10.12659/MSM.943765
15 Apr 2024 : Laboratory Research
The Role of Copper-Induced M2 Macrophage Polarization in Protecting Cartilage Matrix in OsteoarthritisMed Sci Monit In Press; DOI: 10.12659/MSM.943738
07 Mar 2024 : Clinical Research
Knowledge of and Attitudes Toward Clinical Trials: A Questionnaire-Based Study of 179 Male Third- and Fourt...Med Sci Monit In Press; DOI: 10.12659/MSM.943468
08 Mar 2024 : Animal Research
Modification of Experimental Model of Necrotizing Enterocolitis (NEC) in Rat Pups by Single Exposure to Hyp...Med Sci Monit In Press; DOI: 10.12659/MSM.943443
Most Viewed Current Articles
17 Jan 2024 : Review article
Vaccination Guidelines for Pregnant Women: Addressing COVID-19 and the Omicron VariantDOI :10.12659/MSM.942799
Med Sci Monit 2024; 30:e942799
14 Dec 2022 : Clinical Research
Prevalence and Variability of Allergen-Specific Immunoglobulin E in Patients with Elevated Tryptase LevelsDOI :10.12659/MSM.937990
Med Sci Monit 2022; 28:e937990
16 May 2023 : Clinical Research
Electrophysiological Testing for an Auditory Processing Disorder and Reading Performance in 54 School Stude...DOI :10.12659/MSM.940387
Med Sci Monit 2023; 29:e940387
01 Jan 2022 : Editorial
Editorial: Current Status of Oral Antiviral Drug Treatments for SARS-CoV-2 Infection in Non-Hospitalized Pa...DOI :10.12659/MSM.935952
Med Sci Monit 2022; 28:e935952