26 July 2020 : Meta-Analysis
Integrated Analysis of Three Publicly Available Gene Expression Profiles Identified Genes and Pathways Associated with Clear Cell Renal Cell Carcinoma
YuPing Han1ACD, LinLin Wang2EF, Ye Wang3AB*DOI: 10.12659/MSM.919965
Med Sci Monit 2020; 26:e919965


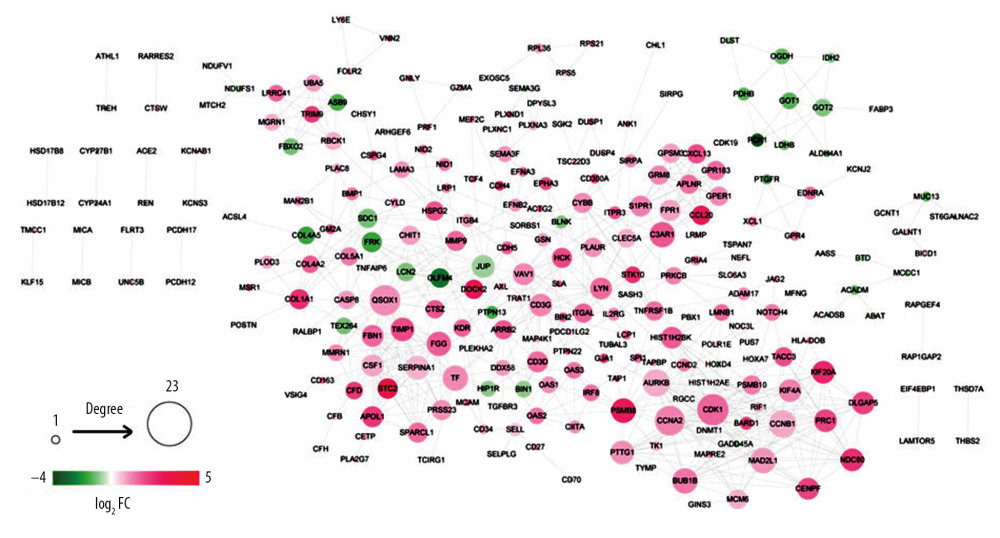
Figure 2 PPI network. The differentially expressed genes were mapped to proteins based on STRING database. PPI network was visualized using Cytoscape software. Green – downregulated genes; red – upregulated genes. The size of node indicates the node degree. PPI – protein–protein interaction; STRING – Search Tool for the Retrieval of Interacting Genes/Proteins.