13 June 2020 : Database Analysis
Comprehensive Analysis of Competing Endogenous RNA (ceRNA) Network Based on RNAs Differentially Expressed in Lung Adenocarcinoma Using The Cancer Genome Atlas (TCGA) Database
Huaihui Tang1ABCDEF, Zhongshuai Wang2F, Qianqian Shao3F, Yue Wang1FG, Qingshan Yang1AEG*DOI: 10.12659/MSM.922676
Med Sci Monit 2020; 26:e922676


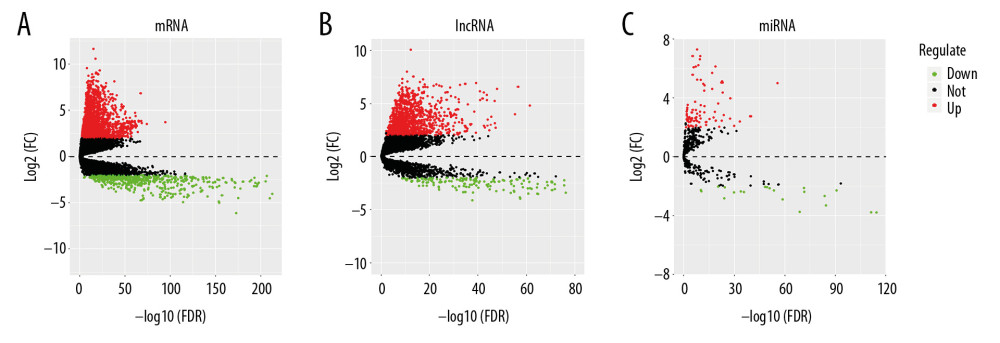
Figure 1 Volcano plots of differential genes in lung adenocarcinoma. (A–C) Shows volcano plots of mRNA, lncRNA, and miRNA, respectively. X-axis represents -log10(FDR), Y-axis represents log2(FC). Black dots represent genes that are not differentially expressed, red dots represent genes that are upregulated, and green dots represent genes that are downregulated. mRNA – messenger RNA; lncRNA – long noncoding RNA; miRNA – microRNA.