13 June 2020: Database Analysis
Comprehensive Analysis of Competing Endogenous RNA (ceRNA) Network Based on RNAs Differentially Expressed in Lung Adenocarcinoma Using The Cancer Genome Atlas (TCGA) Database
Huaihui Tang1ABCDEF, Zhongshuai Wang2F, Qianqian Shao3F, Yue Wang1FG, Qingshan Yang1AEG*DOI: 10.12659/MSM.922676
Med Sci Monit 2020; 26:e922676


Abstract
BACKGROUND: The aim of this study was to explore a comprehensive analysis of the competing endogenous (ceRNA) network of lung adenocarcinoma and predict its regulatory mechanism and prognosis correlation based on The Cancer Genome Atlas (TCGA) database.
MATERIAL AND METHODS: The genes expression data from 535 lung adenocarcinoma cases and 59 normal tissue cases were acquired and downloaded from TCGA database, and differentially expressed messenger RNA (mRNA), long noncoding RNA (lncRNA) and microRNA (miRNA) were selected primarily by “edgeR” package in R software, which further constructs lncRNA-miRNA-mRNA ceRNA network. We then proceed to carry out Gene Ontology enrichment analysis, Kyoto Encyclopedia of Genes and Genomes (KEGG) pathway analysis, and Kaplan-Meier survival analysis of the mRNAs involved in the ceRNA network.
RESULTS: There are 3 mRNAs (ANLN, IGFBP1, and TFAP2A) in differentially expressed genes, 4 lncRNAs (AC015923.1, FGF12-AS2, LINC00211, and MED4-AS1), and 2 miRNAs (miR-31 and miR-490) associated with the prognostic of lung adenocarcinoma. Besides, LINC00461 and has-mir-139 as key nodes were found in the ceRNA network. Significantly, miR-31 shows the greatest prognostic value related to the adverse effect of the prognostic of lung adenocarcinoma (P<0.001).
CONCLUSIONS: By analyzing the expression data of lung adenocarcinoma in TCGA database, we found that 3 mRNAs, 4 lncRNAs, and 2 miRNAs were screened as potential prognostic factors for lung adenocarcinoma. In addition, LINC00461 and has-mir-139 are 2 important regulatory network nodes in lung adenocarcinoma ceRNA.
Keywords: Local Area Networks, Adenocarcinoma of Lung, Databases, Genetic, gene ontology, Gene Regulatory Networks, RNA, RNA, Messenger, Response Elements
Background
Lung adenocarcinoma is the leading cause of cancer deaths in the world, and its mortality rate is still rising [1]. The incidence and mortality of male lung cancer patients rank first in all malignant tumors, and female lung cancer patients account for the second place [2]. Non-small cell lung cancer accounts for about 85% of lung cancer [3] and adenocarcinoma is more common than squamous cell carcinoma [4].
The sequencing of the human genome shows that only a small fraction of the DNA could encode the protein in the entire genome, most of the DNA could not. Most of the transcription products from DNA of these noncoding proteins are noncoding RNAs (ncRNAs) and long noncoding RNAs (lncRNAs) [5]. LncRNA is a type of ncRNA with a transcript longer than 200 nucleotides and lncRNA, although it lacks protein coding ability, plays an important role in cell differentiation and cell metabolism and other related life activities [6]. In 2011, Salmena et al. first proposed the hypothesis of competing endogenous RNA (ceRNA), believed that messenger RNA (mRNA), lncRNA, and other transcription products can be use as ceRNAs to compete and combinate with microRNAs (miRNAs) through the same miRNA response element (MRE) to regulate the expression level of genes and achieve mutual regulation, thereby affecting the function of cells [7]. In addition, ceRNA can competitively bind miRNAs to regulate the number of free miRNAs to influence the translation and silencing effect of miRNAs on their target mRNAs, thereby regulating the expression of target genes [8]. Currently, many experiments have proven that lncRNA can serve as a competitive platform for miRNAs and mRNAs, which allow it to play an important role in the regulation of cell cycle and apoptosis in various malignant tumors such as breast, gastric, liver, lung, and colorectal cancer, thereby affecting tumor invasion and migration. Thus, lncRNA plays an important role in tumorigenesis [9–11], however, its function in the tumor mechanism is still unclear.
The Cancer Genome Atlas (TCGA) is a publicly funded project with the main goal to provide publicly available datasets to help improve diagnostic methods, treatment standards, and ultimately prevent cancer [12]. In this study, we obtained RNA expression profiles and clinical information of lung adenocarcinoma patients from TCGA database, and further constructed the lncRNA-miRNA-mRNA ceRNA network of lung adenocarcinoma. Important biological functions were identified by Gene Ontology (GO) enrichment analysis of differentially expressed mRNAs in ceRNA. The Kyoto Encyclopedia of Genes and Genomes (KEGG) pathway was used to analyze signal transduction and metabolic pathways. The Kaplan-Meier survival analysis was used to identify prognostic characteristics of mRNA, lncRNA, and miRNA involved in the ceRNA network, and to select potential prognostic factors for patients with lung adenocarcinoma.
Material and Methods
TCGA DATA COLLECTION:
Based on GDC (Genomic Data Commons;
IDENTIFICATION OF DIFFERENTIALLY EXPRESSED RNAS:
MRNAs and lncRNAs were encoded according to Gencode Release v30 (GRCh38.p12) (
CERNA NETWORK OF LNCRNA-MIRNA-MRNA:
Based on the screened differentially expressed mRNAs, lncRNAs, and miRNAs, the miRcode (
GO ENRICHMENT ANALYSIS AND KEGG PATHWAYS ANALYSIS:
To explore the potential biological mechanisms of mRNA in the network, a database for annotation, visualization and integrated discovery (DAVID) v6.8 (
SURVIVAL AND PROGNOSIS ANALYSIS:
The effective survival status and survival time were extracted from the clinical data of lung adenocarcinoma patients in TCGA database. By established Lasso regression model and Cox regression model, the differential mRNAs, lncRNAs, and miRNAs related to survival in the network were screened. Survival analysis was performed using the “survival” software package of the R software (set
Results
IDENTIFICATION OF DIFFERENTIALLY EXPRESSED GENES IN LUNG ADENOCARCINOMA:
The mRNAs, lncRNAs, and miRNAs expression data of lung adenocarcinoma were downloaded and extracted from TCGA database. Using the “edgeR” package of R software, we set criteria as fold change (FC) ≥2, FDR (adjusted P-value) <0.01 and average expression values greater than 2. After analysis, 2551 differentially expressed mRNAs were screened, including 2033 upregulated and 518 downregulated, 1359 differentially expressed lncRNAs, including 1185 upregulated and 174 downregulated, 99 differential expression miRNAs, including 78 upregulated and 21 downregulated. The volcano plots were visualized by using “gplots” package of R software (Figure 1A–1C).
CONSTRUCTION OF CERNA NETWORK:
To construct the ceRNA network of lncRNA-miRNA-mRNA, we search 100 differentially expressed lncRNAs through the miRcode database, 43 differential miRNAs corresponding to the 100 differential lncRNAs were found. The predictive target mRNAs for 43 differential miRNAs were retrieved and extracted from the 4 databases of TargetScan, miRDB, miRanda, mirTarBase, respectively. The Venny plot was visualized by using “VennDiagram” package of R software (Figure 2A). Finally, 294 target mRNAs were obtained though intersection with the extracted differentially expressed mRNAs (Figure 2B). Then, we further study 100 lncRNAs, 43 miRNAs, and 294 mRNAs which were involved in the ceRNA network, and 2 sub-networks were extracted. The ceRNA and 2 sub-networks were visualized by Cytoscape v3.7.1 (Figure 3A–3C).
ENRICHMENT ANALYSIS OF DIFFERENTIALLY EXPRESSED MRNA IN CERNA NETWORK:
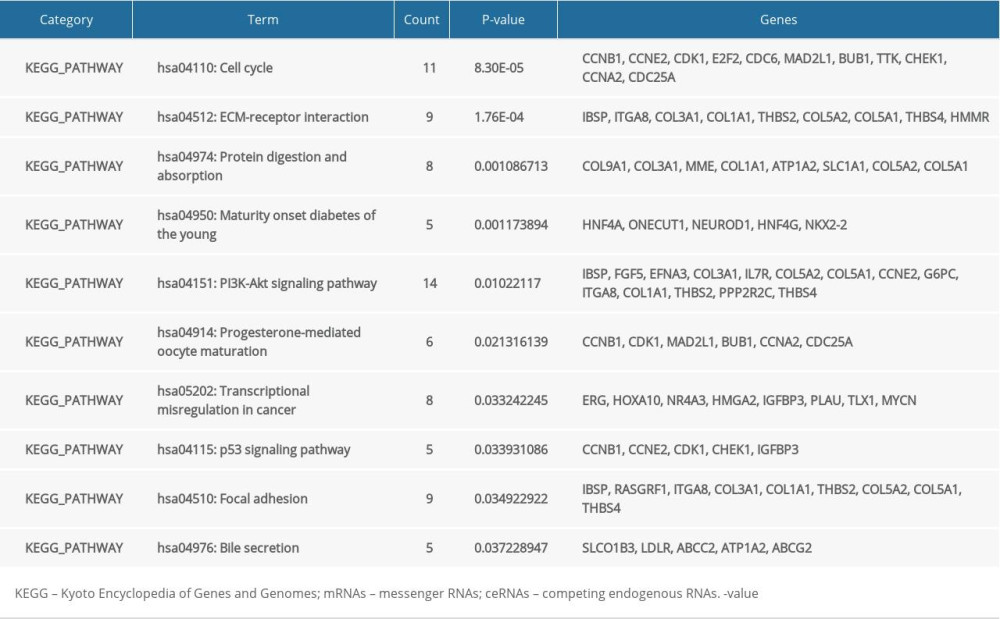
In order to analyze the potential biology of the target mRNAs functions in the ceRNA network, we input the differential mRNAs and remove the background according to the settings to extract the GO enrichment analysis data (set FDR <0.05) by using the DAVID database. 5 enriched GO terms in the molecular function (MF) and biological process (BP) were identified (Figure 4, Table 1). Ten significant pathways identified by the KEGG pathway analysis (set P<0.05) (Figure 5, Table 2).
From the aforementioned, we found that the target mRNAs were significant enrichment in molecular function.
UNIVARIATE COX PROPORTIONAL HAZARD REGRESSION ANALYSIS:
To clarify the prognostic relevance of differential RNAs in lung adenocarcinoma, we performed a univariate Cox proportional hazard regression analysis of 100 lncRNAs, 49 miRNAs, and 294 mRNAs differentially expressed in the ceRNA network to initially screened for differential RNAs expression in lung adenocarcinoma.
BUILDING A LASSO LOGISTIC REGRESSION MODEL: For differential RNAs screened by univariate Cox proportional hazard regression analysis, the data was normalized using a Lasso logistic regression model and overfitted differential RNA models were removed. Before construct the model, it was necessary to further matrix the independent variables (expression data of each sample), set the dependent variables (survival state and survival time) to 2 categorical variables, and applied the Lasso logistic regression model to the independent variables. Variables and dependent variables (Figure 6A–6C).
From the Lasso logistic regression model, λ was a very important parameter in the Lasso regression. The number of independent variables included in the model could be adjusted according to the choice of different λ values. Therefore, determining the optimal λ value of the model was very important for the study. This study used a 10-fold cross-validation method to determine an optimal λ value (Figure 7A–7C).
This study was chosen the values of lambda.min which were 0.06632688, 0.01893901 and 0.00230649, respectively, corresponding to the dotted line on the left side of each figure in Figure 7; and 7 mRNAs, 18 lncRNAs, and 5 miRNAs were screened from the model finally. The variables entering the model at this time have a survival state and a survival time.
MULTI-FACTOR COX RISK REGRESSION ANALYSIS: There were 7 mRNAs, 18 lncRNAs, and 5 miRNAs selected by Lasso regression analysis. Multivariate Cox proportional hazard regression analysis was performed (P<0.05). The forest maps were visualized by “survminer” of R software (Figure 8A–8C).
There were 3 mRNAs (ANLN, IGFBP1, and TFAP2A), 7 lncRNA (AC015923.1, AC017048.3, FGF12-AS2, HOXA11-AS, LINC00211, LINC00319, and MED4-AS1) and 3 miRNAs (hsa-mir-142, hsa-mir-31, and hsa-mir-490) associated with the prognostic of lung adenocarcinoma. Significantly, has-mir-31 shows the greatest prognostic value related with the adverse effect of the prognostic of lung adenocarcinoma (
KAPLAN-MEIER SURVIVAL ANALYSIS: We performed a Kaplan-Meier survival analysis for the 3 mRNAs, 7 lncRNAs, and 3 miRNAs that showed significant prognosis in the forest map and plotted the survival curve by using “survival” package of R software. There were 3 mRNAs (ANLN, IGFBP1, and TFAP2A), 4 lncRNAs (AC015923.1, FGF12-AS2, LINC00211, and MED4-AS1) and 2 miRNAs (hsa-mir-31, and hsa-mir-490) found to be associated with the prognosis of lung adenocarcinoma (Figure 9A–9I).
Then, we further evaluated the risk score of each patient, and divided the patients into a high-risk score group and a low-risk score group with the corresponding median risk score as the boundary, and plotted the risk score curve (Figure 10A–10C). The results showed that the prognosis of the lung adenocarcinoma low-risk score group was significantly better than that of the high-risk score group (P<0.05).
Discussion
Lung adenocarcinoma is the most common histological type of lung cancer, and its morbidity and mortality continue to increase [13,14]. Lung adenocarcinoma treatment includes surgery, chemotherapy, and radiotherapy. Although considerable progress has been made in the treatment of lung adenocarcinoma, the overall treatment effect is still unsatisfying, and the prognosis of patients with lung adenocarcinoma remains poor. The overall 5-year survival rate is still below 15% [15]. Therefore, the exploration of biomarkers that can provide potentially effective target therapy has become a hot spot in current lung adenocarcinoma research [16]. In recent years, the continuous improvement of high-throughput transcriptome sequencing technology and bioinformatics analysis methods has opened up new ideas and provided new methods for studying lung adenocarcinoma [17].
The miRNA is a small molecule ncRNAs of about 22 nucleotides, and about one-third of all human genes are regulated by these RNAs [18]. The gene expression is often not regulated by a single miRNA, but the result of co-regulation by multiple miRNAs [19]. MiRNA specifically binds to target gene mRNA at specific binding sites and participates in the regulation of many important life activities (such as cell differentiation, proliferation, apoptosis, and hormone secretion), thereby inhibiting protein synthesis at the post-transcriptional level [20].
At present, many studies have shown that ceRNA is related to many important biological functions of cancer incidence and development [21]. In addition, a novel regulatory mechanism, the ceRNA hypothesis, which could be mediated through lncRNA, has been proposed [22]. LncRNA XIST has been shown to promote epithelial-to-mesenchymal transition (EMT) of retinoblastoma via sponge miR-101 [23]. Silent lncRNA HOXA-AS2 has been found to inhibit breast cancer cell proliferation and invasion via miR-520c-3p sponge [24]. With the further development and analysis of ceRNA networks, miRNAs, lncRNAs, or mRNAs cannot be considered as single elements in tumors; the expression of mRNAs changes with miRNAs, eventually leading to the occurrence of tumors [25]. Because of the complex mechanisms of cancer development, the role of a single gene or pathway is likely very limited. Therefore, systematic construction and analysis of ceRNA networks can provide more effective research directions for us to study potential cancer mechanisms.
In this study, we used R software to screen differentially expressed genes in lung adenocarcinoma from TCGA database, and further constructed the ceRNA network of lncRNA-miRNA-mRNA in lung adenocarcinoma. We also found that LINC00461 and has-mir-139 are 2 important network nodes in lung adenocarcinoma ceRNA network. Moreover, we predict the enrichment function and pathway of differential mRNAs involved in ceRNA networks by GO enrichment analysis and KEGG pathway analysis. The correlation between differential genes in the network and overall survival was further explored. We found 3 mRNAs (ANLN, IGFBP1, and TFAP2A) in differentially expressed genes, 4 lncRNAs (AC015923.1, FGF12-AS2, LINC00211, and MED4-AS1) and 2 miRNAs (has-mir-31 and has-mir-490) associated with the prognostic of lung adenocarcinoma. Significantly, has-mir-31 showed the greatest prognostic value related with the adverse effect of the prognostic of lung adenocarcinoma (
Studies have shown that hsa-miR-31 has been identified as a new prognostic biomarker for SCC in Chinese patients [26]. Li et al. found that miRNA-490 regulates lung cancer metastasis by targeting poly (c) binding protein 1, which confirmed that hsa-mir-490-3p may be a potential prognostic marker for lung cancer [27]. Xu et al. showed that the expression of ANLN in lung adenocarcinoma was related to the metastasis of cancer cells. It has also been reported that the expression of ANLN in lung adenocarcinoma is associated with metastasis of cancer cells [28]. Long et al. used immunohistochemical staining in lung adenocarcinoma patients to show high expression of ANLN in adenocarcinoma tissues, and found that the expression level of ANLN was associated with TNM stage and OS rate of lung adenocarcinoma patients, suggesting that ANLN is a potential biomarker for diagnosis and prognosis of lung adenocarcinoma [29]. TFAP2A is an AP-2 family transcription factor that binds the consensus sequence 5′-GCCNNNGGC-3′ and is overexpressed in lung adenocarcinoma. TFAP2A regulates the expression of multiple downstream target genes involved in human cancer development and progression. Liu et al. designed a migration rescue experiment and found that TFAP2A gene knockout could affect EMT and reduce cancer cell migration in lung adenocarcinoma [30]. Shi et al. in a study of TFAP2A found it to be highly expressed in various nasopharyngeal carcinoma cells and tumors, and that it was related to the expression of hypoxia-inducible factor-1α (HIF-1α). In addition, TFAP2A overexpression was positively correlated with tumor staging, local invasion, clinical progress, and poor prognosis in patients with nasopharyngeal carcinoma, which suggests that TFAP2A may be a potential prognostic marker for nasopharyngeal carcinoma [31].
Conclusions
In summary, by analyzing the expression data of lung adenocarcinoma in TCGA database, we found that 3 mRNAs, 4 lncRNAs, and 2 miRNAs were screened as potential prognostic biomarkers for lung adenocarcinoma. In addition, by constructing the lncRNA-miRNA-mRNA ceRNA network we provided new ideas for the competitive interaction between different RNAs in lung adenocarcinoma patients, and we identified LINC00461 and has-mir-139 as 2 important regulatory network nodes in lung adenocarcinoma ceRNA. These findings provided more insights into the regulatory mechanisms underlying lung adenocarcinoma.
Figures
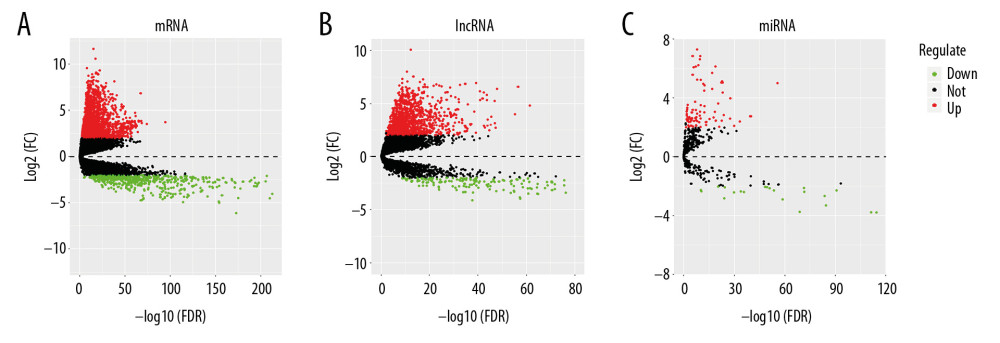 Figure 1. Volcano plots of differential genes in lung adenocarcinoma. (A–C) Shows volcano plots of mRNA, lncRNA, and miRNA, respectively. X-axis represents -log10(FDR), Y-axis represents log2(FC). Black dots represent genes that are not differentially expressed, red dots represent genes that are upregulated, and green dots represent genes that are downregulated. mRNA – messenger RNA; lncRNA – long noncoding RNA; miRNA – microRNA.
 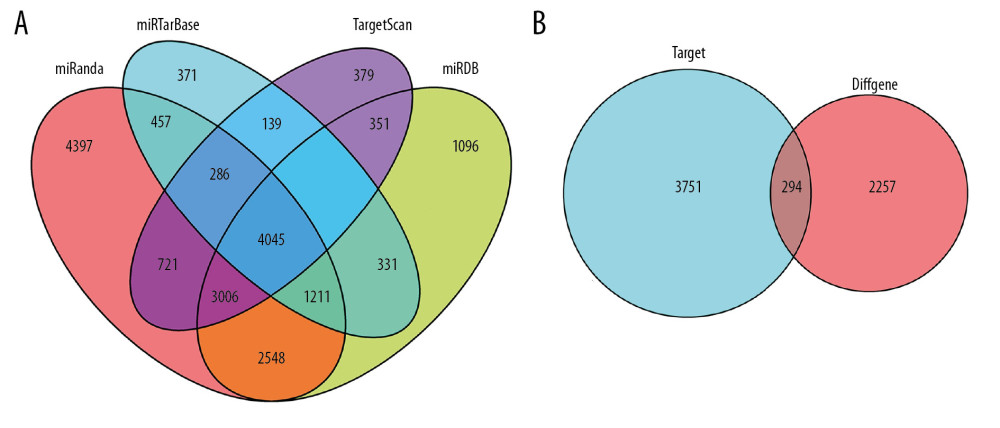 Figure 2. Venny plot. (A) Shows the four database intersections predicting the target mRNAs. (B) Shows the Venny plot of the intersection with the differential mRNAs, which target represents the mRNAs of the intersection from the 4 databases, and diffGene represents the differentially expressed mRNAs. mRNAs – messenger RNAs.
 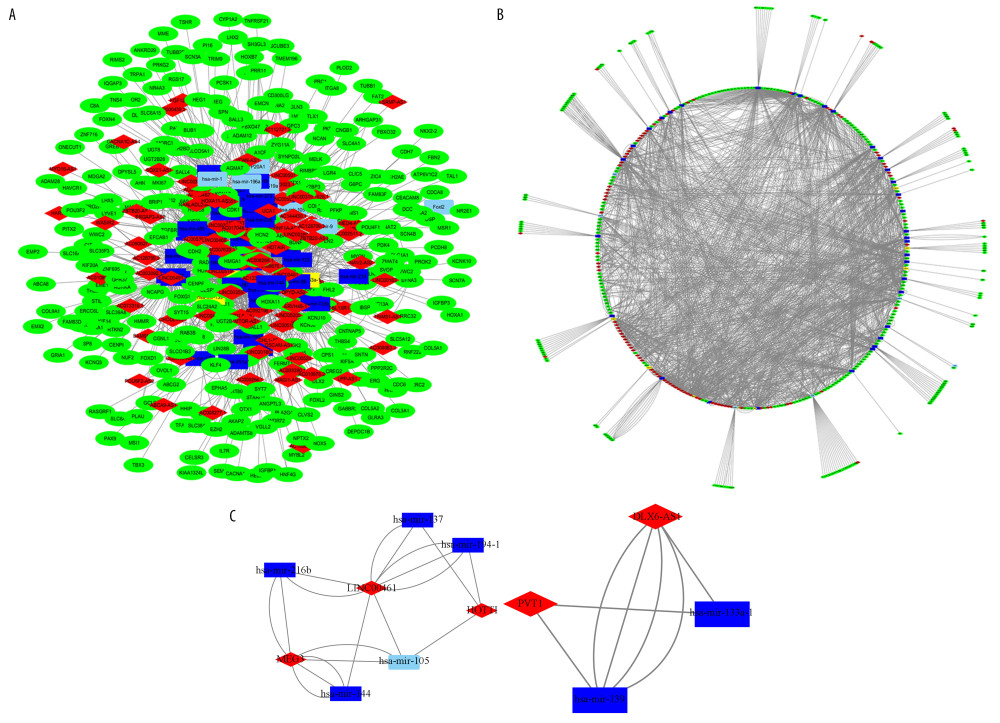 Figure 3. CeRNA network of lncRNA-miRNA-mRNA in lung adenocarcinoma. (A, B) Shows the constructed ceRNA network and the circular layout ceRNA network of lncRNA-miRNA-mRNA of lung adenocarcinoma. (C, D) Shows a sub-network with LINC00461 and hsa-mir-139 as the key node, respectively. Green circles represent mRNAs, red diamonds represent lncRNAs, blue quadrilaterals represent miRNAs, gray lines represent lncRNA-miRNA-mRNA interactions. ceRNA – competing endogenous RNA; lncRNA – long noncoding RNA; miRNA – microRNA; mRNA – messenger RNA.
 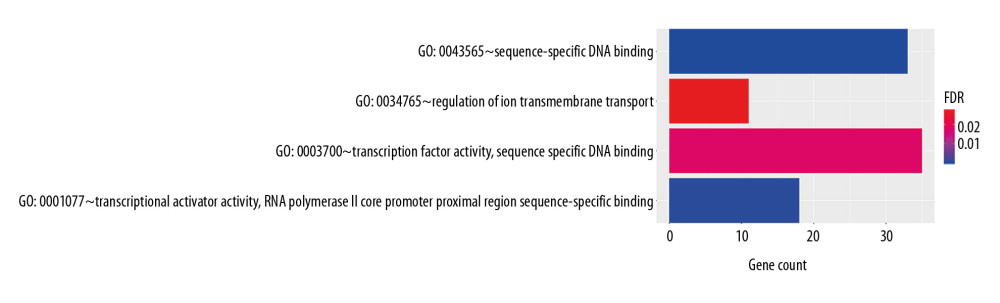 Figure 4. GO enrichment of mRNAs included in the ceRNA network. The target mRNAs were significant enrichment in molecular function. GO – Gene Ontology; mRNAs – messenger RNAs; ceRNA – competing endogenous RNA.
 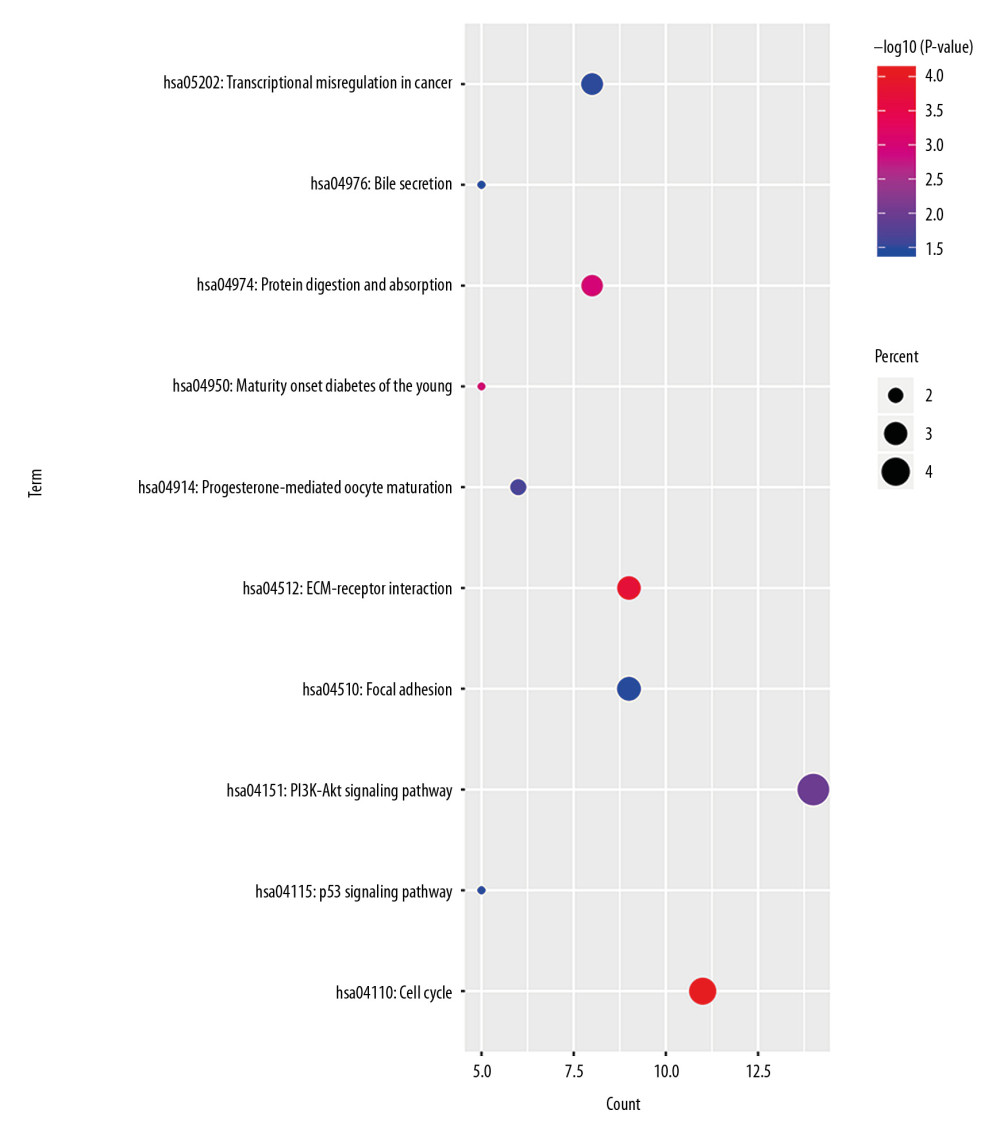 Figure 5. KEGG pathway enrichment of mRNAs included in the ceRNA network. KEGG – Kyoto Encyclopedia of Genes and Genomes; mRNAs – messenger RNAs; ceRNA – competing endogenous RNAs.
 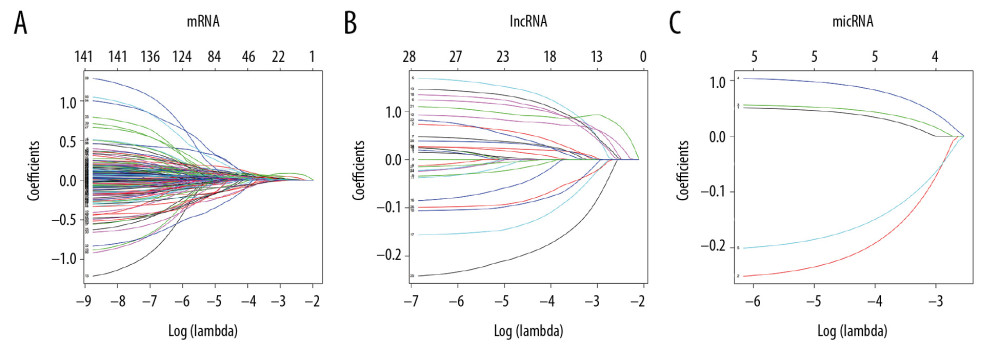 Figure 6. Lasso regression model of RNAs in lung adenocarcinoma. (A–C) Shows Lasso regression models of mRNA, lncRNA and miRNA, respectively. Each line represents a sample. The Y-axis of the graph represents the coefficients of the sample, the top axis represents the number of samples, and the bottom axis represents the logarithm of the parameter λ (Log(lambda)). mRNA – messenger RNA, lncRNA – long noncoding RNA; miRNA – microRNA.
 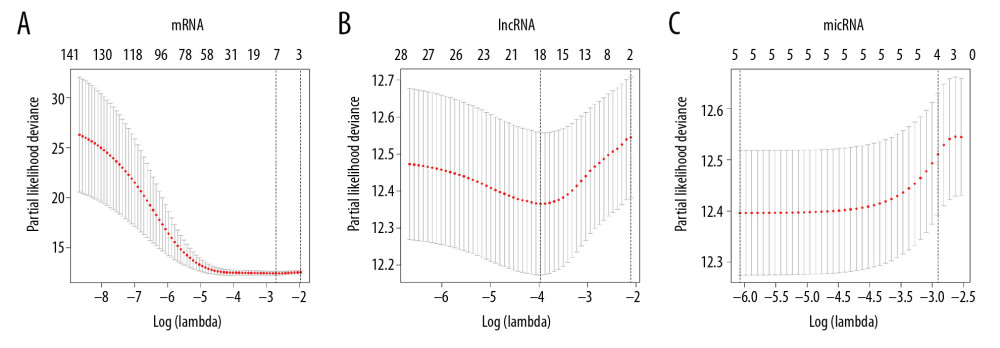 Figure 7. Ten times cross validation of RNAs in lung adenocarcinoma. (A–C) Shows 10 times cross validations of mRNA, lncRNA, and miRNA, respectively. The 2 dotted lines represent 2 special lambda values, lambda.min and lambda.1se. Lambda.min refers to the lambda value of the mean value of the smallest target parameter among all the lambda values, and lambda.1se refers to the lambda value of the most compact model obtained within a variance of lambda.min. mRNA – messenger RNA, lncRNA – long noncoding RNA; miRNA – microRNA.
 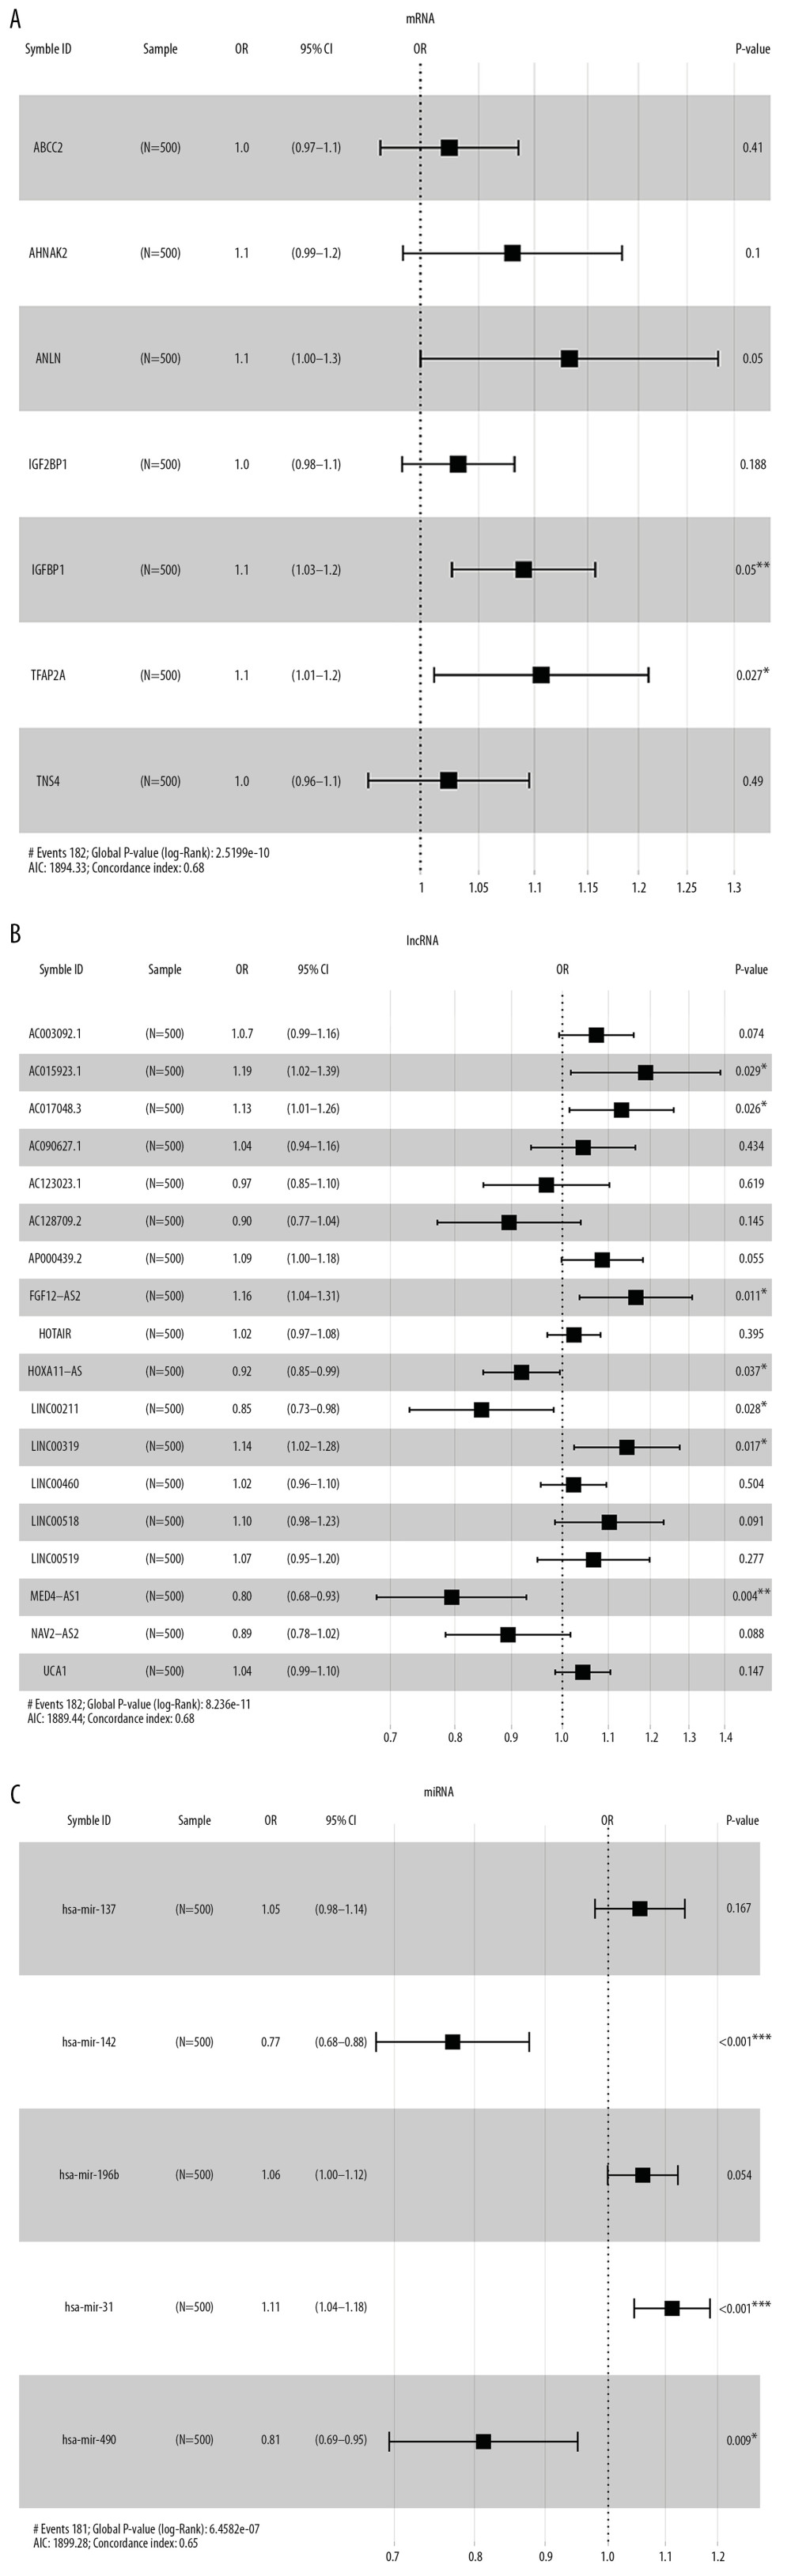 Figure 8. Forest maps of survival associated RNAs in the ceRNA network. (A–C) Shows forest maps of mRNA, lncRNA and miRNA, respectively. A P-value of <0.05 was considered statistically significant, and * indicates a P-value <0.05; ** indicates a P-value of <0.01; *** indicates a P-value of <0.001. ceRNA – competing endogenous RNA; mRNA – messenger RNA, lncRNA – long noncoding RNA; miRNA – microRNA.
 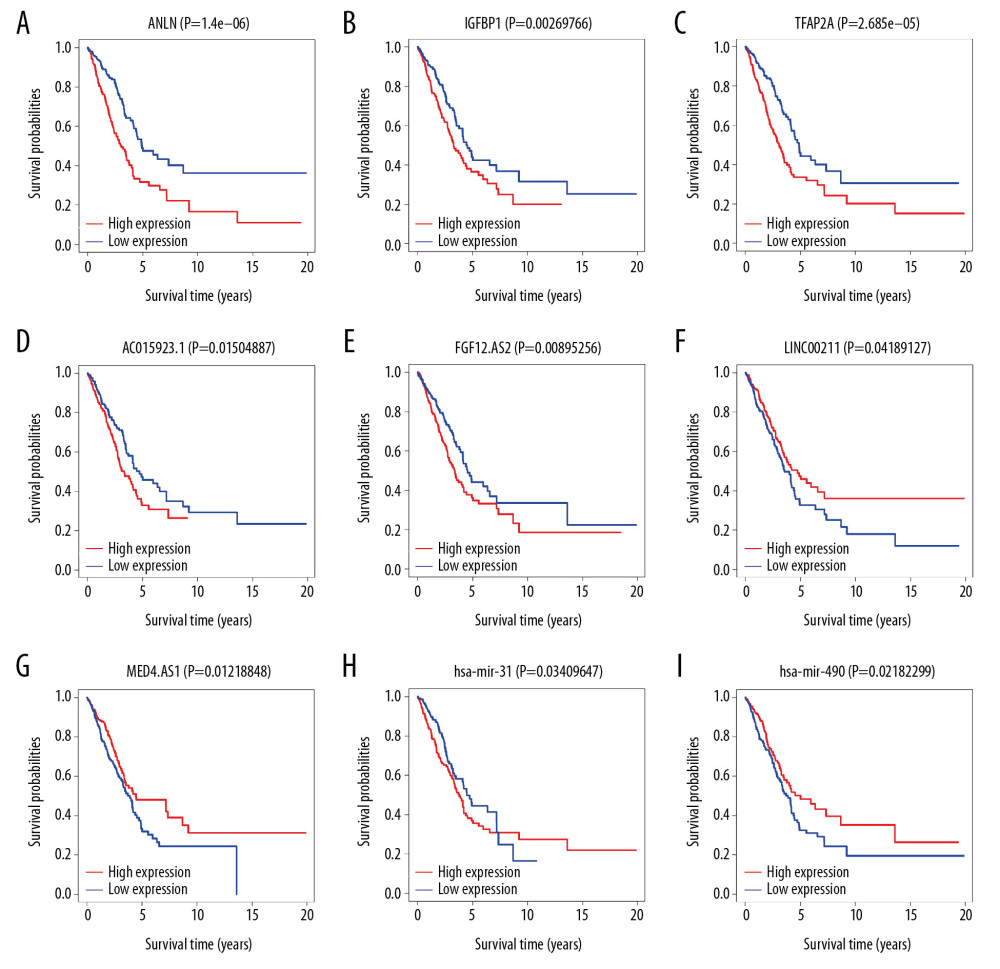 Figure 9. Kaplan-Meier survival curve. (A–C) Shows Kaplan-Meier survival curves for 3 mRNAs (ANLN, IGFBP1, and TFAP2A). (D–G) Shows Kaplan-Meier survival curves for 4 lncRNAs (AC015923.1, FGF12-AS2, LINC00211, and MED4-AS1), (H, I) Shows Kaplan-Meier survival curves for 2 miRNAs (hsa-mir-31 and hsa-mir-490). X-axis represents survival time in years and Y-axis represents survival probabilities. mRNA – messenger RNA; lncRNA – long noncoding RNA – miRNA, microRNA.
 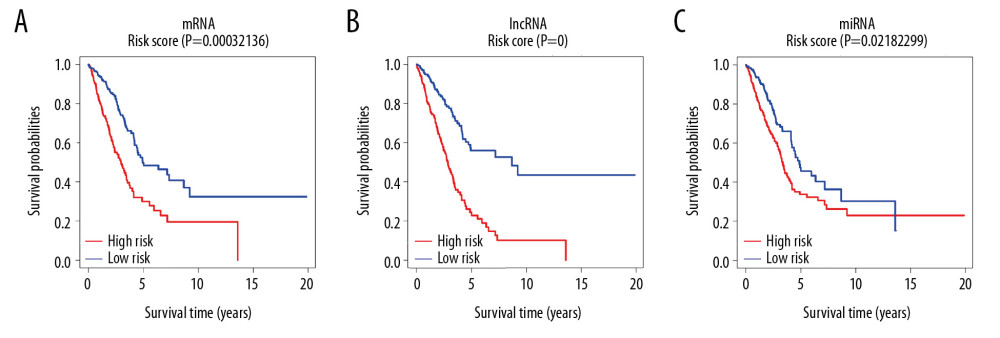 Figure 10. Risk score curve. (A–C) Shows risk score curves of mRNA, lncRNA and miRNA, respectively. X-axis represents survival time in years and Y-axis represents survival probabilities. mRNA – messenger RNA; lncRNA – long noncoding RNA; miRNA – microRNA.
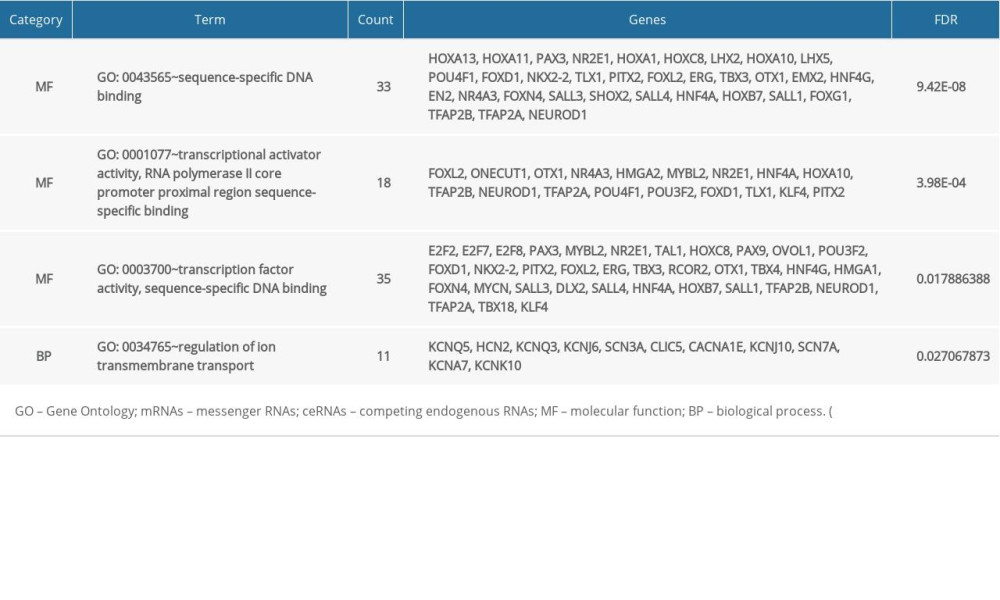
References
1. Liu H, Zhou G, Fu X, Long noncoding RNA TUG1 is a diagnostic factor in lung adenocarcinoma and suppresses apoptosis via epigenetically silencing of BAX: Oncotarget, 2017; 8; 101899-910
2. Torre LA, Bray F, Siegel RL, Global cancer statistics, 2012: Cancer J Clin, 2015; 65(2); 87-108
3. Yang J, Lin J, Liu T, Analysis of lncRNA expression profiles in non-small cell lung cancers (NSCLC) and their clinical subtypes: Lung Cancer, 2014; 85(2); 110-15
4. Xiao J, Lu X, Chen X, Eight potential biomarkers for distinguishing between lung adenocarcinoma and squamous cell carcinoma: Oncotarget, 2017; 8(42); 71759-717
5. Chen J, Xue Y, Emerging roles of non-coding RNAs in epigenetic regulation: Sci China Life Sci, 2016; 59(3); 227-35
6. Rinn JL, Chang HY, Genome regulation by long noncoding RNAs: Annu Rev Biochem, 2012; 81; 145-66
7. Salmena L, Poliseno L, Tay Y, A ceRNA hypothesis: The Rosetta Stone of a hidden RNA language: Cell, 2011; 146(3); 353-58
8. Wang H, Huo X, Yang XR, STAT3-mediated upregulation of lncRNA HOXD-AS1 as a ceRNA facilitates liver cancer metastasis by regulating SOX4: Mol Cancer, 2017; 16(1); 136
9. Chen X, Chen Z, Yu S, Long noncoding RNA LINC01234 functions as a competing endogenous RNA to regulate CBFB expression by sponging miR-204-5p in gastric cancer: Clin Cancer Res, 2018; 24(8); 2002-14
10. Xie CR, Wang F, Zhang S, Long noncoding RNA HCAL facilitates the growth and metastasis of hepatocellular carcinoma by acting as a ceRNA of LAPTM4B: Mol Ther Nucleic Acids, 2017; 9; 440-51
11. Liu XH, Sun M, Nie FQ, LncRNA HOTWIRE functions as a competing endogenous RNA to regulate HER2 expression by sponging miR-331-3p in gastric cancer: Mol Cancer, 2014; 13(1); 92
12. Tomczak K, Czerwińska P, Wiznerowicz M, Review The Cancer Genome Atlas (TCGA): An immeasurable source of knowledge: Contemp Oncol (Pozn), 2015; 19(1A); A68-77
13. Siegel RL, Miller KD, Fedewa SA, Colorectal cancer statistics, 2017: Cancer J Clin, 2017; 67(3); 177-93
14. Jemal A, Bray F, Center MM, Global cancer statistics: Cancer J Clin, 2011; 61(2); 69-90
15. Wakeam E, Acuna SA, Leighl NB, Surgery versus chemotherapy and radiotherapy for early and locally advanced small cell lung cancer: A propensity-matched analysis of survival: Lung Cancer, 2017; 109; 78-88
16. Vargas AJ, Harris CC, Biomarker development in the precision medicine era: lung cancer as a case study: Nat Rev Cancer, 2016; 16(8); 525-37
17. Rau A, Maugis-Rabusseau C, Martin-Magniette ML, Celeux G, Co-expression analysis of high-throughput transcriptome sequencing data with Poisson mixture models: Bioinformatics, 2015; 31(9); 1420-27
18. Fromm B, Billipp T, Peck LE, A uniform system for the annotation of vertebrate microRNA genes and the evolution of the human microRNAome: Annu Rev Genet, 2015; 49; 213-42
19. Xu P, Wang JH, Sun B, Xiao Z, Integrated analysis of miRNA and mRNA expression data identifies multiple miRNAs regulatory networks for the tumorigenesis of colorectal cancer: Gene, 2018; 659; 44-51
20. Xiong SD, Zheng YJ, Jiang P, MicroRNA-7 inhibits the growth of human non-small cell lung cancer A549 cells through targeting BCL-2: Int J Biol Sci, 2011; 7(6); 805-14
21. Xu J, Li Y, Lu J, The mRNA related ceRNA–ceRNA landscape and significance across 20 major cancer types: Nucleic Acids Res, 2015; 43(17); 8169-82
22. Yang S, Ning QQ, Zhang GB, Construction of differential mRNA -lncRNA crosstalk networks based on ceRNA hypothesis uncover key roles of lncRNAs implicated in esophageal squamous cell carcinoma: Oncotarget, 2016; 7(52); 85728-40
23. Cheng Y, Chang Q, Zheng B, LncRNA XIST promotes the epithelial to mesenchymal transition of retinoblastoma via sponging miR-101: Eur J Pharmacol, 2019; 843; 210-16
24. Fang Y, Wang J, Wu F, Long non-coding RNA HOXA-AS2 promotes proliferation and invasion of breast cancer by acting as a miR-520c-3p sponge: Oncotarget, 2017; 8(28); 46090-103
25. Masood AH, Mustafa K, Dominic H, Deregulated microRNA and mRNA expression profiles in the peripheral blood of patients with Marfan syndrome: J Transl Med, 2018; 16; 60
26. Tan X, Qin W, Zhang L, A 5-microRNA signature for lung squamous cell carcinoma diagnosis and hsa-miR-3 for prognosis: Clin Cancer Res, 2011; 17(21); 6802-11
27. Li J, Feng Q, Wei X, Yu Y, MicroRNA-490 regulates lung cancer metastasis by targeting poly r(C)-binding protein 1: Tumour Biol, 2016; 37(11); 15221-28
28. Xu J, Zheng H, Yuan S, Overexpression of ANLN in lung adenocarcinoma is associated with metastasis: Thorac Cancer, 2019; 10(8); 1702-9
29. Long XY, Zhou W, Wang YX, Liu SQ, Prognostic significance of ANLN in lung adenocarcinoma: Oncol Lett, 2018; 16(2); 1835-40
30. Liu YH, Qian PD, Zhu W, TFAP2A induced KRT16 as an oncogene in lung adenocarcinoma via EMT: Int J Biol Sci, 2019; 15(7); 1419-28
31. Shi D, Xie F, Zhang Y, TFAP2A regulates nasopharyngeal carcinoma growth and survival by targeting HIF-1α signaling pathway: Cancer Prev Res (Phila), 2014; 7(2); 266-77
Figures
Figure 1. Volcano plots of differential genes in lung adenocarcinoma. (A–C) Shows volcano plots of mRNA, lncRNA, and miRNA, respectively. X-axis represents -log10(FDR), Y-axis represents log2(FC). Black dots represent genes that are not differentially expressed, red dots represent genes that are upregulated, and green dots represent genes that are downregulated. mRNA – messenger RNA; lncRNA – long noncoding RNA; miRNA – microRNA.Figure 2. Venny plot. (A) Shows the four database intersections predicting the target mRNAs. (B) Shows the Venny plot of the intersection with the differential mRNAs, which target represents the mRNAs of the intersection from the 4 databases, and diffGene represents the differentially expressed mRNAs. mRNAs – messenger RNAs.Figure 3. CeRNA network of lncRNA-miRNA-mRNA in lung adenocarcinoma. (A, B) Shows the constructed ceRNA network and the circular layout ceRNA network of lncRNA-miRNA-mRNA of lung adenocarcinoma. (C, D) Shows a sub-network with LINC00461 and hsa-mir-139 as the key node, respectively. Green circles represent mRNAs, red diamonds represent lncRNAs, blue quadrilaterals represent miRNAs, gray lines represent lncRNA-miRNA-mRNA interactions. ceRNA – competing endogenous RNA; lncRNA – long noncoding RNA; miRNA – microRNA; mRNA – messenger RNA.Figure 4. GO enrichment of mRNAs included in the ceRNA network. The target mRNAs were significant enrichment in molecular function. GO – Gene Ontology; mRNAs – messenger RNAs; ceRNA – competing endogenous RNA.Figure 5. KEGG pathway enrichment of mRNAs included in the ceRNA network. KEGG – Kyoto Encyclopedia of Genes and Genomes; mRNAs – messenger RNAs; ceRNA – competing endogenous RNAs.Figure 6. Lasso regression model of RNAs in lung adenocarcinoma. (A–C) Shows Lasso regression models of mRNA, lncRNA and miRNA, respectively. Each line represents a sample. The Y-axis of the graph represents the coefficients of the sample, the top axis represents the number of samples, and the bottom axis represents the logarithm of the parameter λ (Log(lambda)). mRNA – messenger RNA, lncRNA – long noncoding RNA; miRNA – microRNA.Figure 7. Ten times cross validation of RNAs in lung adenocarcinoma. (A–C) Shows 10 times cross validations of mRNA, lncRNA, and miRNA, respectively. The 2 dotted lines represent 2 special lambda values, lambda.min and lambda.1se. Lambda.min refers to the lambda value of the mean value of the smallest target parameter among all the lambda values, and lambda.1se refers to the lambda value of the most compact model obtained within a variance of lambda.min. mRNA – messenger RNA, lncRNA – long noncoding RNA; miRNA – microRNA.Figure 8. Forest maps of survival associated RNAs in the ceRNA network. (A–C) Shows forest maps of mRNA, lncRNA and miRNA, respectively. A P-value of <0.05 was considered statistically significant, and * indicates a P-value <0.05; ** indicates a P-value of <0.01; *** indicates a P-value of <0.001. ceRNA – competing endogenous RNA; mRNA – messenger RNA, lncRNA – long noncoding RNA; miRNA – microRNA.Figure 9. Kaplan-Meier survival curve. (A–C) Shows Kaplan-Meier survival curves for 3 mRNAs (ANLN, IGFBP1, and TFAP2A). (D–G) Shows Kaplan-Meier survival curves for 4 lncRNAs (AC015923.1, FGF12-AS2, LINC00211, and MED4-AS1), (H, I) Shows Kaplan-Meier survival curves for 2 miRNAs (hsa-mir-31 and hsa-mir-490). X-axis represents survival time in years and Y-axis represents survival probabilities. mRNA – messenger RNA; lncRNA – long noncoding RNA – miRNA, microRNA.Figure 10. Risk score curve. (A–C) Shows risk score curves of mRNA, lncRNA and miRNA, respectively. X-axis represents survival time in years and Y-axis represents survival probabilities. mRNA – messenger RNA; lncRNA – long noncoding RNA; miRNA – microRNA. In Press
Clinical Research
Body Weight and Insulin Resistance Indicators Among ChildrenMed Sci Monit In Press; DOI: 10.12659/MSM.951434
Clinical Research
Comparison of Radiographic Cervical Sagittal Alignment Parameters in Patients With Nonspecific Neck Pain, D...Med Sci Monit In Press; DOI: 10.12659/MSM.952950
Clinical Research
Combined Fibrinogen and Urinary α1-Microglobulin as Predictors of Respiratory Tract Infection in Children w...Med Sci Monit In Press; DOI: 10.12659/MSM.951066
Database Analysis
Evaluation of Salivary Total Oxidant Status (TOS) and Total Antioxidant Status (TAS) in Orthodontic Patient...Med Sci Monit In Press; DOI: 10.12659/MSM.952052
Most Viewed Current Articles
17 Jan 2024 : Review article 14,175,576
Vaccination Guidelines for Pregnant Women: Addressing COVID-19 and the Omicron VariantDOI :10.12659/MSM.942799
Med Sci Monit 2024; 30:e942799
13 Nov 2021 : Clinical Research 3,756,620
Acceptance of COVID-19 Vaccination and Its Associated Factors Among Cancer Patients Attending the Oncology ...DOI :10.12659/MSM.932788
Med Sci Monit 2021; 27:e932788
14 Dec 2022 : Clinical Research 2,465,966
Prevalence and Variability of Allergen-Specific Immunoglobulin E in Patients with Elevated Tryptase LevelsDOI :10.12659/MSM.937990
Med Sci Monit 2022; 28:e937990
16 May 2023 : Clinical Research 708,651
Electrophysiological Testing for an Auditory Processing Disorder and Reading Performance in 54 School Stude...DOI :10.12659/MSM.940387
Med Sci Monit 2023; 29:e940387