13 June 2020 : Database Analysis
Comprehensive Analysis of Competing Endogenous RNA (ceRNA) Network Based on RNAs Differentially Expressed in Lung Adenocarcinoma Using The Cancer Genome Atlas (TCGA) Database
Huaihui Tang1ABCDEF, Zhongshuai Wang2F, Qianqian Shao3F, Yue Wang1FG, Qingshan Yang1AEG*DOI: 10.12659/MSM.922676
Med Sci Monit 2020; 26:e922676


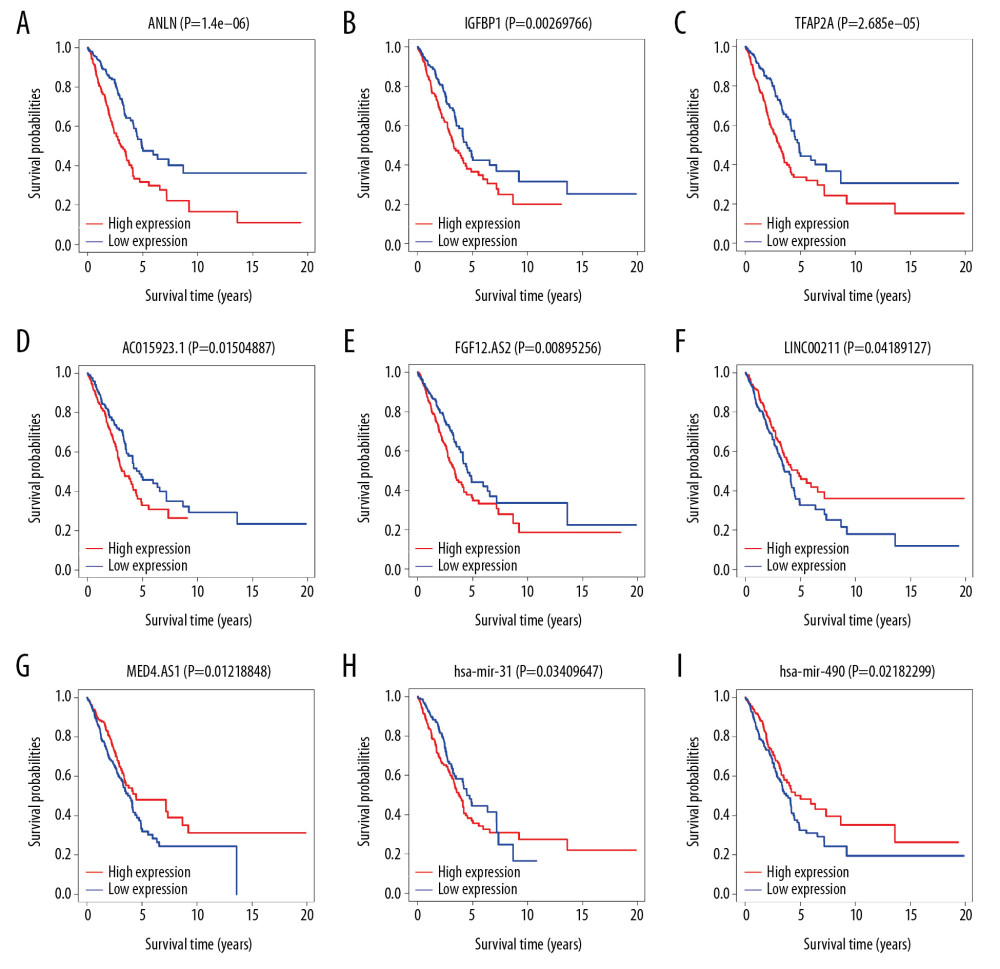
Figure 9 Kaplan-Meier survival curve. (A–C) Shows Kaplan-Meier survival curves for 3 mRNAs (ANLN, IGFBP1, and TFAP2A). (D–G) Shows Kaplan-Meier survival curves for 4 lncRNAs (AC015923.1, FGF12-AS2, LINC00211, and MED4-AS1), (H, I) Shows Kaplan-Meier survival curves for 2 miRNAs (hsa-mir-31 and hsa-mir-490). X-axis represents survival time in years and Y-axis represents survival probabilities. mRNA – messenger RNA; lncRNA – long noncoding RNA – miRNA, microRNA.