04 August 2020 : Database Analysis
Sirtuin 3 mRNA Expression is Downregulated in the Brain Tissues of Alzheimer’s Disease Patients: A Bioinformatic and Data Mining Approach
Shuang Song12ABCDEF, Bin Li12A, Zhen Jia12C, Li Guo12AG*DOI: 10.12659/MSM.923547
Med Sci Monit 2020; 26:e923547


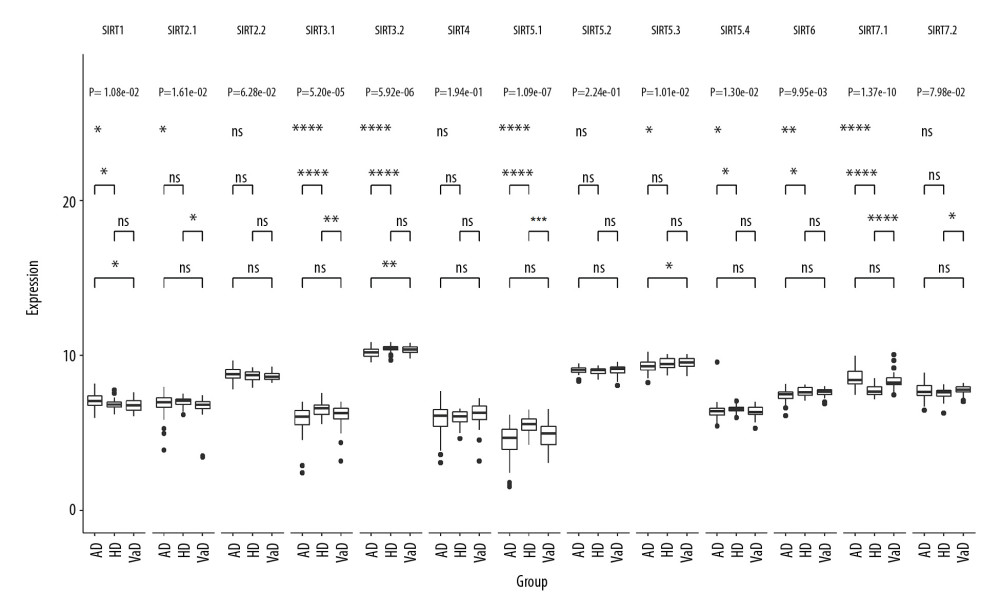
Figure 3 Boxplot of multigroup comparisons of the sirtuin-related RNA expression levels among the VaD, Alzheimer’s disease (AD) and control groups in dataset GSE122063. At the top of the figure, sirtuin gene symbols indicate subgroup information; below, Kruskal-Wallis P values among the VaD, AD, and control groups are shown. At the bottom of the figure, boxes representing the sirtuin-related RNA expression values from the microarray are shown, and the post hoc subgroup comparison results are shown between the RNA expression boxes and Kruskal-Wallis P-values. Represents P<0.0001, represents P<0.001, ** P<0.01, ** P<0.05, and ns P≥0.05. ND indicates “no dementia” as the control group.