04 August 2020 : Database Analysis
Sirtuin 3 mRNA Expression is Downregulated in the Brain Tissues of Alzheimer’s Disease Patients: A Bioinformatic and Data Mining Approach
Shuang Song12ABCDEF, Bin Li12A, Zhen Jia12C, Li Guo12AG*DOI: 10.12659/MSM.923547
Med Sci Monit 2020; 26:e923547


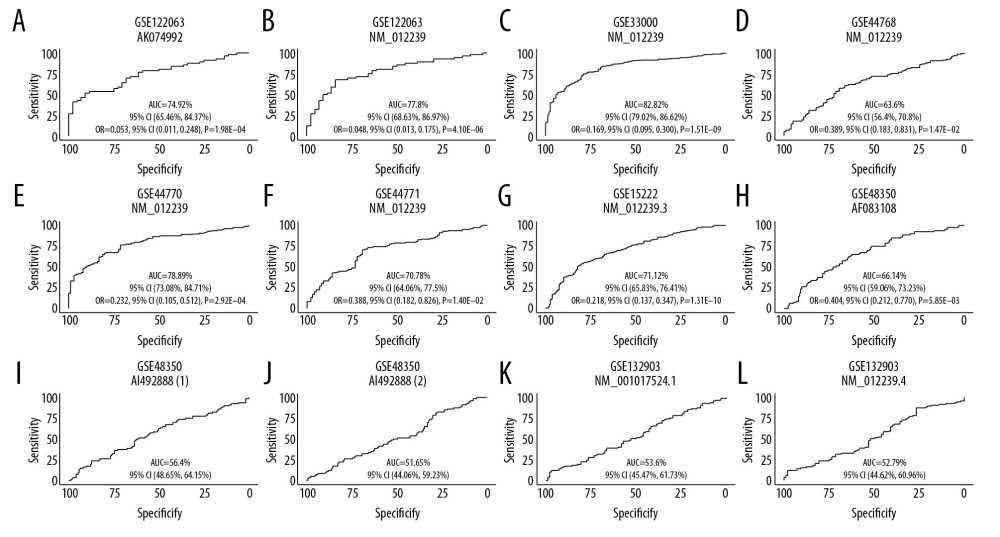
Figure 4 (A–L) ROC curve of the SIRT3 RNA levels for diagnosis of Alzheimer’s disease in 8 datasets. The gene symbol and GenBank accession ID on top of each ROC curve provide the subgroup information. The AUC, 95% CI of the AUC, OR, 95% CI of the OR and Wald test P value of SIRT3 RNA expression are shown under the curve. If the 95% CI of the AUC included 50%, further logistic regression would not proceed. ROC – receiver operating characteristic curve; AUC – area under the curve; CI – confidence interval; OR – odds ratio.