04 August 2020 : Database Analysis
Sirtuin 3 mRNA Expression is Downregulated in the Brain Tissues of Alzheimer’s Disease Patients: A Bioinformatic and Data Mining Approach
Shuang Song12ABCDEF, Bin Li12A, Zhen Jia12C, Li Guo12AG*DOI: 10.12659/MSM.923547
Med Sci Monit 2020; 26:e923547


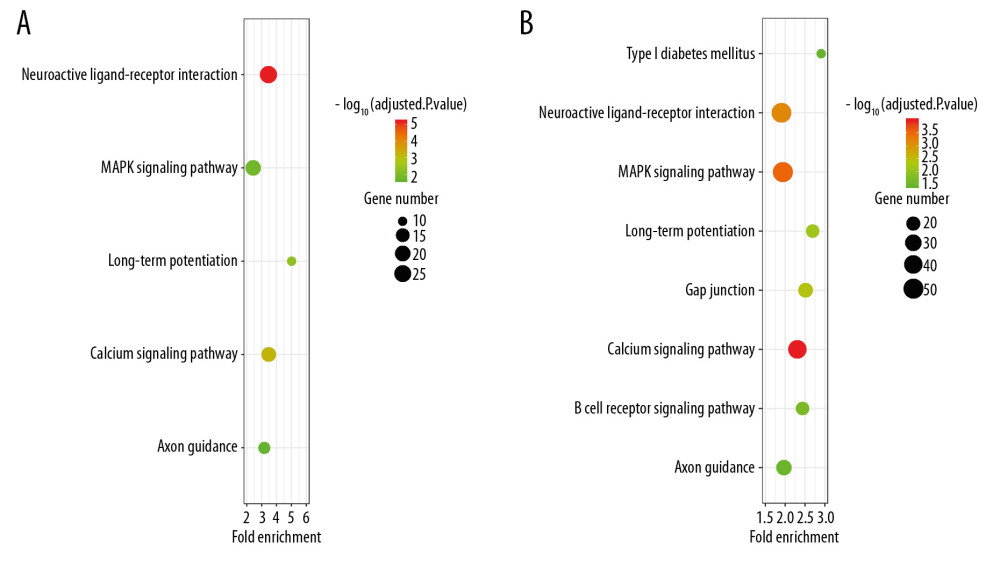
Figure 6 Bubble plot for the enriched Kyoto Encyclopedia of Genes and Genomes pathways of the Alzheimer’s disease (AD)-related differentially expressed genes (DEGs) and the SIRT3-related DEGs. (A) The enriched pathways of the SIRT3-related DEGs. (B) The enriched pathways of the AD-related DEGs. The size of the bubble represents the gene number enriched in that pathway, and the color of the bubble represents the adjusted P-value of the pathway. The X axis represents the fold change of the pathway.