29 June 2020 : Laboratory Research
Potential Molecular Mechanisms and Drugs for Aconitine-Induced Cardiotoxicity in Zebrafish through RNA Sequencing and Bioinformatics Analysis
Mingzhu Wang1CDEF, Yanan Shi1BDF, Lei Yao1CDF, Qiang Li2ACDFG, Youhua Wang3ABDFG, Deyu Fu1ABEFG*DOI: 10.12659/MSM.924092
Med Sci Monit 2020; 26:e924092


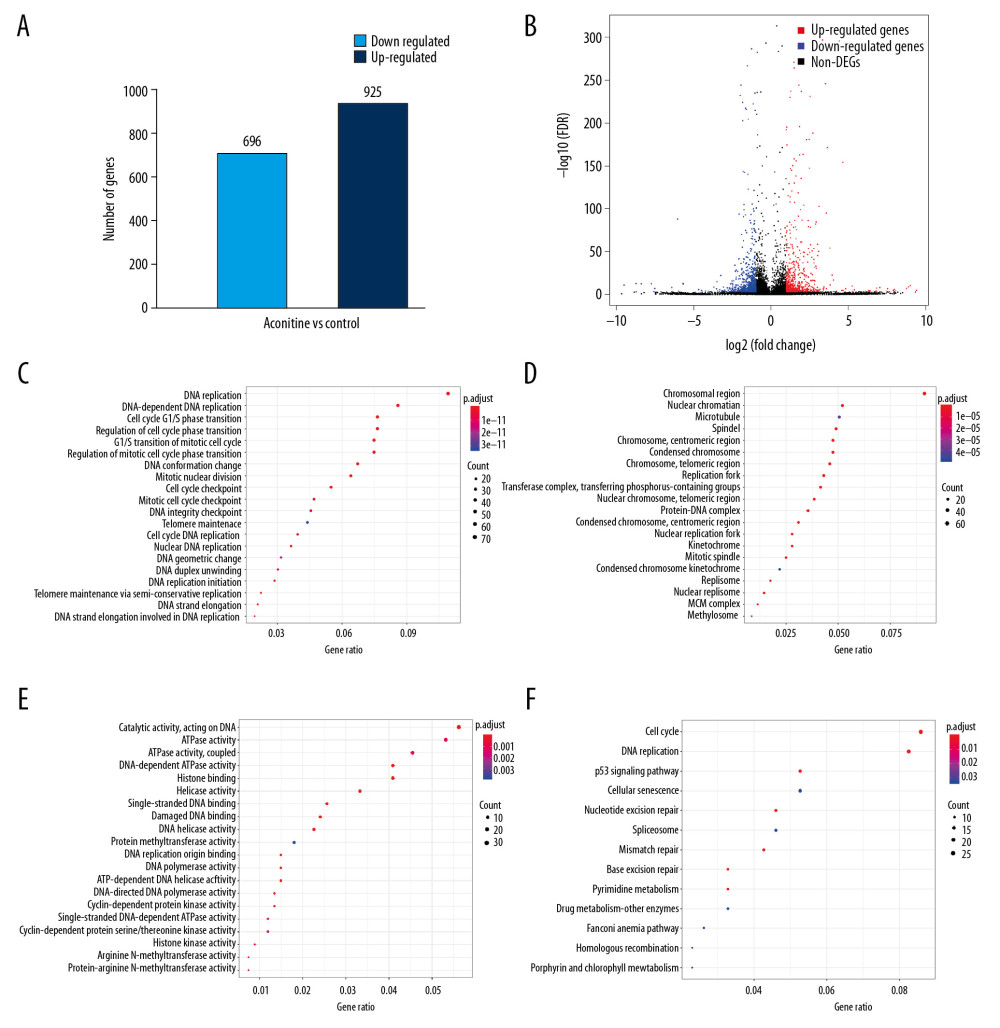
Figure 2 (A) Statistical chart of the number of DEGs. The horizontal axis represents a comparison of different samples, the vertical axis represents the number of DEGs, red represents upregulation, blue represents downregulation. (B) Volcano plot of DEGs. The figure contains an interactive scatter plot that displays the log2-fold changes and statistical significance of each gene calculated by performing a differential gene expression analysis. Each dot in the volcano plot of DEGs represents a gene. Red points indicate significantly upregulated genes, blue points indicate downregulated genes, and the black dots represent non-differentially expressed genes. The axes display the significance versus fold-change estimated by the differential expression analysis. The results of the GO and KEGG enrichment analysis of all DEGs. (C) Biological process. (D) Cellular component. (E) Molecular function. (F) KEGG pathway. The size of the point represents the number of genes enriched, and the depth of the color represents the size of the P-value. The X-axis is the name of the items arranged according to the degree of enrichment, and the Y-axis is the size of the gene ratio. DEGs – differentially expressed genes; GO – Gene Ontology; KEGG – Kyoto Encyclopedia of Genes and Genomes.