19 August 2020 : Database Analysis
Screening and Identification of Potential Peripheral Blood Biomarkers for Alzheimer’s Disease Based on Bioinformatics Analysis
Xin Wang1BCD, Lantao Wang1AEF*DOI: 10.12659/MSM.924263
Med Sci Monit 2020; 26:e924263


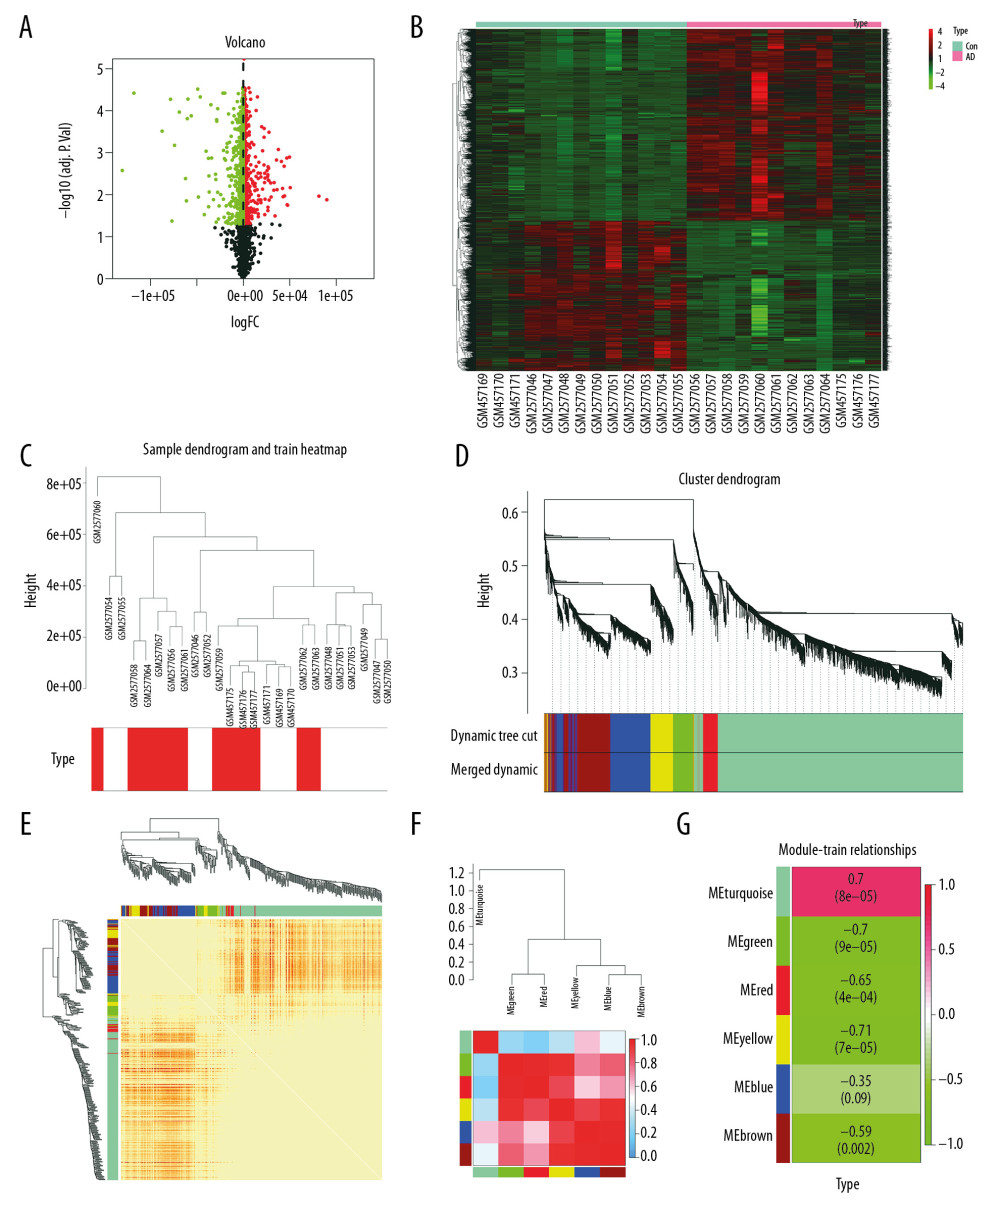
Figure 1 Differential expression analysis and WGCNA analysis of the genes in the merged series. (A) Volcano plots of the DEGs between AD group and control group. (B) Heatmaps of the DEGs in the merged series. (C) Cluster of patients with clinical information; the red line represents patients with AD. (D) Repeated hierarchical clustering tree of the 5042 genes. (E) Dendrogram and heatmap of the DEGs. (F) Interactions between these modules. (G) Associations between clinical traits and the modules; the MEyellow module has the highest correlation with clinical traits. WGCNA – weighted correlation network analysis; DEGs – differently expressed genes; AD – Alzheimer’s disease.