04 November 2020 : Animal Research
Isobaric Tagging for Relative and Absolute Protein Quantification (iTRAQ)-Based Quantitative Proteomics Analysis of Differentially Expressed Proteins 1 Week After Spinal Cord Injury in a Rat Model
Shen Liu1ABCE, Yi Kang1BCE, Chi Zhang1BCE, Yongfu Lou1BCE, Xueying Li2BF, Lu Lu1BF, Zhangyang Qi1BF, Huan Jian1BF, Hengxing Zhou1ADG*DOI: 10.12659/MSM.924266
Med Sci Monit 2020; 26:e924266


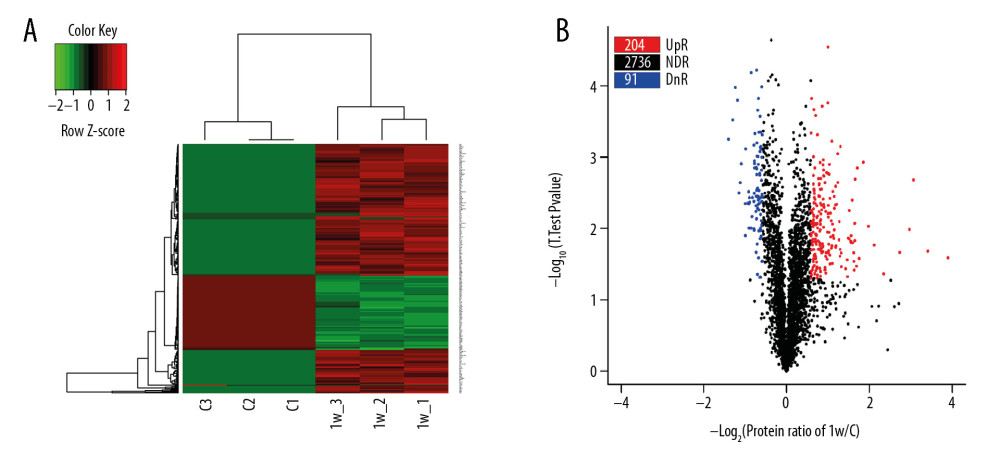
Figure 1 Heatmap and Volcano plot of the differentially expressed proteins (DEPs). (A) Heatmap of DEPs, in which red represents upregulated DEPs and green represents downregulated DEPs. (B) Volcano plot of DEPs. The X axis is the fold change (log 2), and the Y axis represents the P value (−log 10). Red points (fold change >1.5) indicate upregulated proteins, and blue points (fold change <−1.5) indicate downregulated proteins.