04 November 2020: Animal Study
Isobaric Tagging for Relative and Absolute Protein Quantification (iTRAQ)-Based Quantitative Proteomics Analysis of Differentially Expressed Proteins 1 Week After Spinal Cord Injury in a Rat Model
Shen Liu1ABCE, Yi Kang1BCE, Chi Zhang1BCE, Yongfu Lou1BCE, Xueying Li2BF, Lu Lu1BF, Zhangyang Qi1BF, Huan Jian1BF, Hengxing Zhou1ADG*DOI: 10.12659/MSM.924266
Med Sci Monit 2020; 26:e924266


Abstract
BACKGROUND: Spinal cord injury (SCI) is a devastating trauma of the central nervous system (CNS), with high levels of morbidity, disability, and mortality. One week after SCI may be a critical time for treatment. Changes in protein expression have crucial functions in nervous system diseases, although the effects of changes occurring 1 week after SCI on patient outcomes are unclear.
MATERIAL AND METHODS: Protein expression was examined in a rat contusive SCI model 1 week after SCI. Differentially expressed proteins (DEPs) were identified by isobaric tagging for relative and absolute protein quantification (iTRAQ)-coupled liquid chromatography tandem-mass spectrometry (LC-MS/MS) proteomics analysis. Gene Ontology (GO) analysis was performed to identify the biological processes, molecular functions, and cellular component terms of the identified DEPs, and the Kyoto Encyclopedia of Genes and Genomes (KEGG) was used to identify key enriched pathways. Protein–protein interaction (PPI) networks were analyzed to identify the top 10 high-degree core proteins.
RESULTS: Of the 295 DEPs identified, 204 (69.15%) were upregulated and 91 (30.85%) were downregulated 1 week after injury. The main cellular components, molecular functions, biological processes, and pathways identified may be crucial mechanisms involved in SCI. The top 10 high-degree core proteins were complement component C3 (C3), alpha-2-HS-glycoprotein (Ahsg), T-kininogen 1 (Kng1), Serpinc1 protein (Serpinc1), apolipoprotein A-I (Apoa1), serum albumin (Alb), disulfide-isomerase protein (P4hb), transport protein Sec61 subunit alpha isoform 1 (Sec61a1), serotransferrin (Tf), and 60S ribosomal protein L15 (Rpl15).
CONCLUSIONS: The proteins identified in this study may provide potential targets for diagnosis and treatment 1 week after SCI.
Keywords: Protein Interaction Maps, Proteomics, Spinal Cord Injuries, gene ontology, Isotope Labeling, Proteins, Proteome
Background
Spinal cord injury (SCI) is a serious traumatic injury with high levels of morbidity, disability, and mortality, as well as many complications [1]. SCI is usually caused by high-energy impact. In developed countries such as the United States, most SCIs are caused by motor vehicle accidents [2], whereas in developing countries such as China, SCIs are more frequently caused by falls [3]. Due to high-energy damage, primary SCIs include damage to the blood spinal cord barrier (BSCB), ischemic and related cell injury, cell necrosis, apoptosis, and alarmin release. This may be followed by a series of secondary injuries, including inflammatory responses, extravasation of infiltrating leukocytes, and proliferation of and morphological changes to the glia, which ultimately leads to the development of a chronically axon-inhibitory structure called the glial scar [4]. Secondary SCI injury can be divided into several pathophysiologic stages, including acute stage (<48 h), subacute stage (48 h to 14 days), moderate stage (14 days to 6 months), and chronic stage (>6 months) [5]. Ischemia and excitotoxicity during the subacute phase lead to a loss of intracellular and extracellular ion homeostasis. The imbalance of calcium regulation in neurons and glial cells is the main mediator of cell death. In addition, increased expression of hypertrophic astrocytes and glial fibrillary acidic protein (GFAP) also participate in formation of the glial scar, a physical and chemical barrier that limits functional recovery [6]. The subacute period is a potential crucial treatment phase [7]. Previous studies published by our research team identified key proteins and predicted critical pathways 2 weeks after SCI [8]. Although several proposed treatment methods, including surgery, drug treatment, and cell therapy, have been associated with positive effects, few patients experience complete neurological functional recovery, and there is currently no effective or universally accepted treatment for SCI [9]. Determination of protein expression 1 week after SCI may establish a spectrum of differentially expressed proteins (DEP), enabling better understanding of the molecular mechanisms and potential therapeutic targets of SCI.
Proteomics is a science of studying the composition and changes of protein at the cell, tissue, organ, or organism level. Proteomics is of great significance in the early diagnosis, subtyping, monitoring of process and curative effect, prognosis, and molecular mechanism of disease. Recent advances in proteomics technology have enabled the use of animal disease models or biological samples from clinical observational studies to study differential proteomics in SCI [10]. Although traditional molecular biology techniques such as PCR and western blotting have been used to analyze the pathological mechanisms of SCI, it remains difficult to accurately identify the biomolecules that play important roles in dynamic changes of the microenvironment after SCI and in the evolution of the many biological processes and key signal pathways that are activated through the progression of injury. Isobaric tagging for relative and absolute protein quantification (iTRAQ) is a method with high throughput, stability, and sensitivity to sample properties, and can be used to evaluate the pathological mechanisms associated with SCI [11].
The present study utilized iTRAQ-coupled liquid chromatography tandem-mass spectrometry (LC-MS/MS) proteomics analysis to compare protein expression levels 1 week after induction of SCI in a rat model with protein expression in control rats. These findings may establish a profile of differentially expressed proteins 1 week after SCI. In addition, these finding may help clarify the potential molecular pathological mechanisms underlying SCI, aid in further exploration of therapeutic targets, and provide a basis for clinical treatment.
Material and Methods
EXPERIMENTAL ANIMALS:
Eighteen adult female Wistar rats weighing 190–220 g were obtained from the Military Medical Sciences Academy (Tianjin, China). All animal procedures in this study were approved by the Animal Experimental Ethics Inspection Committee of Tianjin Medical University and conformed to the approved guidelines on the protection and use of experimental animals. All Wistar rats were adapted to preoperative conditions for 7 days in a controlled environment (23±1°C) under a 12-h dark/light cycle and were allowed water and food ad libitum.
MODEL OF SPINAL CORD CONTUSION INJURY:
The 18 rats were randomly divided into 2 equal groups. Rats in the control group did not undergo surgery but only underwent laminectomy at the level of the tenth thoracic vertebra (T10) prior to tissue extraction. Rats in the injured group were administered a contusive SCI at T10 using the New York University (NYU) impactor model II (10 g×25 mm) as well as undergoing laminectomy at the T10 level. After SCI, the hindlimbs of rats in the injured group exhibited involuntary twitches and tail waggling, conforming to the described standard for this model [12]. The bladder of each rat in the injured group was artificially emptied twice per day. All rats were sacrificed 1 week later, and a 10-mm length of spinal cord tissue, including the center of the SCI, was subsequently removed.
PROTEIN EXTRACTION:
Protein extraction, iTRAQ labeling, and LC-MS/MS were performed as described [8]. Spinal cord samples from 3 rats in each group, weighing approximately 200 mg, were stored at −80°C. Each sample was incubated in 300 μL lysis buffer (8 M urea, 50 mM Tris, pH 8.0, 10 mM DTT, 2 mM EDTA, 1% NP40, 1% NaDOC, and 1% proteinase inhibitors), homogenized at 800 rpm, and subjected to ultrasound on ice to dissolve the sample. The samples were subsequently centrifuged at 20 000 g for 10 min at 4°C. The protein concentration of the interlayer solution was determined using a 2D Quant kit (GE Healthcare) after repeated centrifugation. A 30-μg aliquot of protein of each sample was subjected to 12% SDS-PAGE.
ITRAQ LABELING:
A 500-μg aliquot of each protein sample was withdrawn, and differences in volume were made up by the addition of lysis buffer. The samples were incubated at 30°C for 40 min with 5 mM DTT (Solarbio, Biotechnology) to reduce the disulfide bonds. After cooling to room temperature, the samples were incubated in the dark for 40 min with 40 mM iodoacetamide (Sigma, BioUltra) to alkylate the free sulfhydryl groups. An 8-fold volume of acetone pre-cooled to −20°C was added to each sample to precipitate the proteins, followed by incubation overnight at −20°C. The samples were centrifuged at 20 000 g for 10 min at 4°C, the liquid was discarded, and the pellet was rinsed with 80% acetone pre-cooled to −20°C and incubated at −20 °C for 1 h. The pellets were rinsed once with pre-cooled acetone, the supernatant was discarded, the proteins were precipitated at room temperature for 10 min, and the residual acetone was volatilized. Each protein pellet was resuspended in 300 μl triethylammonium bicarbonate (TEAB, 0.1 M, Sigma, BioUltra) and ultrasonically dissolved at 4°C. Trypsin (5 μg) was added to each solution, and the solutions were incubated overnight at 37°C. Enzymolysis was terminated by the addition of 1% trifluoroacetic acid (TFA; Sigma, HPLC), followed by desalting on a C18 SPE (Phenomenex) column. The eluted peptides were dried using a matched vacuum concentrator.
In addition, the peptide fragments were dissolved in an appropriate amount of 0.5 M TEAB, with 50 μg of each sample labeled with TMT reagent (Pierce) at room temperature for 1 h.
LC-MS/MS:
After drying, the labeled peptide fragments were redissolved in liquid phase solution A; 25 μg of each of the 2 samples were added to each replication group, followed by centrifugation at 20 000 g for 10 min. Each supernatant was loaded onto a C18 column and antigradient separation was performed by high-performance liquid chromatography (HPLC; Shimadzu, LC20AD) under alkaline conditions. Approximately 20 of the above peptide fragments were combined into 7 components after elution according to the peak-appearing extended protein, and they were dried using a vacuum concentrator. Each of the 7 predissociated fractions was dissolved in liquid phase solution A, and the supernatants were centrifuged at 20 000 g for 10 min. Samples were analyzed on an LC (Dionex, Ultimate RSLCnano 3000)-MS (Thermo Scientific, Q Exariented plus) system, with each 1-μg fragment requiring 1 h. The LC-MS system was also used to analyze 7 predissociated components in each group. Qualitative calculations were performed using Mascot software.
PROTEIN IDENTIFICATION AND QUANTITATION:
The raw data were processed and converted using the Mascot search engine (Matrix Science, v.2.3.02) and maascot generic file with Proteome Discoverer (Thermo Scientific, v1.4.1.14). A total of 29 982 sequences of tandem-mass spectra were retrieved using a rat reference proteome. The mass error of precursor ions was set at 10 PPM and fragment ions at 0.02 Da. Enzyme specificity was determined by trypsin and 2 missed cleavages were allowed. The iTRAQ 8-plex tag on Lys, the N-terminal peptide, and the carbamidomethylation tag on Cys were specified as fixed modifications, whereas iTRAQ 8-plex tag on Tyr and oxidation on Met were specified as variable modification. False discovery rates (FDR) were estimated from a Decoy (reverse) database. The algorithm percolator and PSMs (Peptide-Spectrum Match) were used to revalue the calculated results using a
GO ANALYSIS:
Investigation of the roles of the identified DEPs were determined using Gene Ontology (GO) analysis. The biological processes (BP), cellular components (CC), and molecular functions (MF) were analyzed. GO analyses were performed by R software with the cluster Profiler package, and Fisher’s exact tests were performed to analyze distinct terms. A
KEGG ANALYSIS:
The roles of the identified DEPs were explored by pathway enrichment analysis of Kyoto Encyclopedia of Genes and Genomes (KEGG). The pathways corresponding to the process were analyzed by KEGG analysis using R software with the cluster Profiler package to conduct KEGG analyses, and distinct pathways were evaluated by Fisher’s exact test. A
PPI NETWORK CONSTRUCTION:
The Search Tool for the Retrieval of Interacting Genes (STRING) database has been shown to indicate protein–protein interactions (PPIs) [13]. In the present study, the PPIs of the DEPs were analyzed by the STRING database using the cut-off value of a confidence score ≥0.7. PPI network results were analyzed with Cytoscape software [14].
WESTERN BLOTTING (WB):
Western blotting was performed as described [8], with slight modifications. Spinal cord tissues were lysed on mice using the RIPA lysis buffer, supplemented with protease inhibitor cocktail (Roche, Indianapolis, IN, USA). The samples were subjected to ultrasound treatment to reduce their viscosity, and their protein concentrations were determined by bicinchoninic acid assays (Pierce, Rockford, IL, USA). Equal aliquots of protein were separated on 10% sodium dodecyl sulfate-polyacrylamide gels and transferred to polyvinylidene difluoride (PVDF) membranes (Millipore). The membranes were incubated overnight at 4°C with primary antibodies against GAPDH (1: 4000, Abcam), T-kininogen 1 (Kng1) (1: 1000, Proteintech), sodium- and chloride-dependent GABA transporter 3 (Gat3) (1: 1000, Abcam), and sodium/potassium-transporting ATPase subunit beta (Atp1b2) (1: 1000, Proteintech). After washing, the membranes were incubated with secondary anti-rabbit or anti-mouse antibody (1: 10 000, Abcam) labeled with horseradish peroxidase, followed by incubation with enhanced chemiluminescence substrates (Pierce) and visualization of the immunoreactive bands. Results were quantified using Image J software, and band intensities were normalized to those of GAPDH.
STATISTICAL ANALYSIS:
Statistical analyses were performed using SPSS17.0 and R software. Fold-changes >1.5 and
Results
ITRAQ DATA:
iTRAQ analysis of spinal cord samples 1 week after SCI identified 295 DEPs; of these proteins, 204 (69.15%) were upregulated and 91 (30.85%) were downregulated in SCI compared with control samples. A heatmap is shown in Figure 1A and a volcano plot in Figure 1B. The top 10 downregulated and upregulated DEPs are listed in detail in Table 1.
GO AND KEGG ENRICHMENT ANALYSIS:
Target proteins were annotated by GO and KEGG enrichment. GO term annotation results indicated that the DEPs were enriched in enzyme inhibitor activity, response to stress, defense response, regeneration, response to steroid hormone, neurotransmitter transport, and inflammatory response (Figure 2A). Of these, enzyme inhibitor activity, response to stress, defense response, regeneration, response to steroid hormone, and inflammatory response were the upregulated GO terms, whereas neurotransmitter transporter activity was the downregulated GO term (Figure 2B, 2C). KEGG enrichment analysis showed that complement and coagulation cascades, Staphylococcus aureus infection, lysosome, carbohydrate digestion and absorption, mineral absorption, systemic lupus erythematosus, ribosome, proximal tubule bicarbonate reclamation, antigen processing and presentation, phagosome, glycosaminoglycan degradation, pertussis, thyroid hormone synthesis, and leishmaniasis were enriched pathways (Figure 3A). Of these, complement and coagulation cascades, Staphylococcus aureus infection, lysosome, systemic lupus erythematosus, ribosome, antigen processing and presentation, phagosome, glycosaminoglycan degradation, pertussis, and leishmaniasis were upregulated, whereas carbohydrate digestion and absorption, mineral absorption, proximal tubule bicarbonate reclamation, and thyroid hormone were downregulated pathways (Figure 3B, 3C).
PPI NETWORK ANALYSIS:
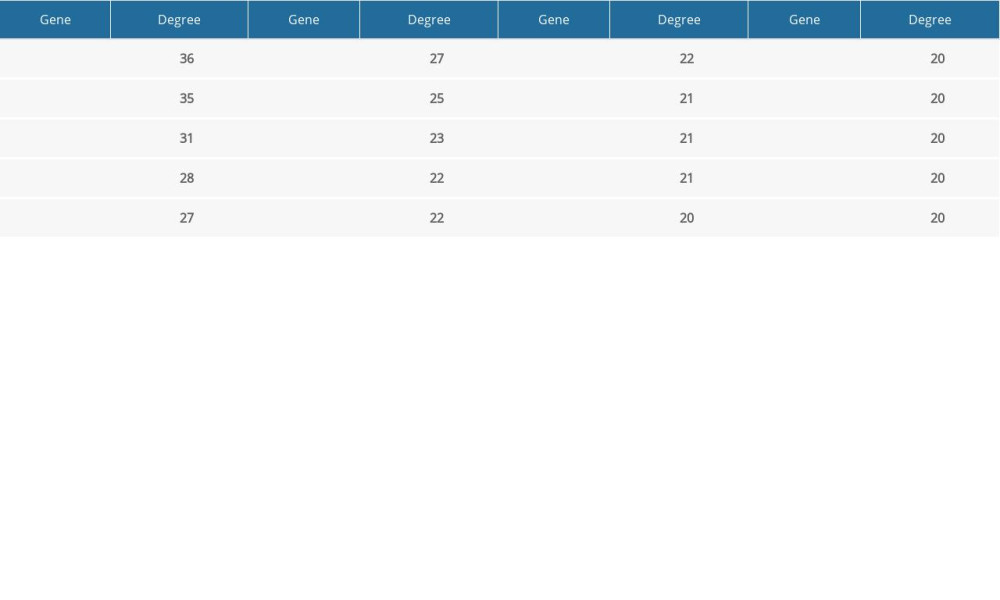
PPI network analysis of the DEPs showed 228 nodes and 899 connections (Figure 4). The top 10 core DEPs were complement component C3 (C3), alpha-2-HS-glycoprotein (Ahsg), T-kininogen 1 (Kng1), Serpinc1 protein (Serpinc1), apolipoprotein A-I (Apoa1), serum albumin (Alb), disulfide-isomerase protein (P4hb), transport protein Sec61 subunit alpha isoform 1 (Sec61a1), serotransferrin (Tf), and 60S ribosomal protein L15 (Rpl15). C3 displayed the highest node degree among these 36 genes. All of these DEPs were upregulated. The core genes are listed in detail in Table 2.
WESTERN BLOTTING:
Western blotting experiments were performed to validate the changes in expression of 3 of the top 10 downregulated and upregulated DEPs. The expression of Kng1 increased significantly, whereas the expression of Gat3 and Atp1b2 decreased significantly, in the injured compared with the control group (Figure 5, P<0.05).
Discussion
SCI is a serious CNS trauma that leads to long-term neurological injury and other complications in patients, along with a heavy socioeconomic burden [15,16]. The pathophysiology of SCI is very complex, as it affects the nervous, immune, respiratory, and circulatory systems, as well as other systemic functions [17,18]. One week after SCI may be the optimal treatment window, and pathological changes at this stage may be crucial in the secondary injury of SCI [6]. Nevertheless, few studies have explored the expression of proteins 1 week after SCI. The present study found significantly different protein expression levels in spinal cord tissue after SCI. GO and KEGG analyses were performed to identify the functions of these DEPs, and the STRING database was used to investigate a series of core proteins that may be critical 1 week after SCI.
GO enrichment analyses of the DEPs revealed that enzyme inhibitor activity, response to stress, defense response, regeneration, response to steroid hormones, neurotransmitter transport, and inflammatory response were significantly enriched in spinal cords of rats with SCI. Of these, enzyme inhibitor activity, response to stress, defense response, regeneration, response to steroid hormones, and inflammatory response were upregulated, whereas neurotransmitter transporter activity was downregulated. Sildenafil citrate, a phosphodiesterase inhibitor, was found to exert a neuroprotective effect on the spinal cord after ischemia/reperfusion injury by attenuating inflammatory mediators [19]. Our team’s previous study showed that a synthetic serine protease inhibitor, nafamostat mesylate, could attenuate inflammation and apoptosis and promote locomotor recovery after SCI [20]. Other biological events play an early protective role, such as the defense response caused by the response to stress. Nevertheless, stress pathway modulation has been reported to be detrimental or ineffective for functional recovery after SCI [21]. Methylprednisolone is frequently used to treat SCI, but it has deleterious long-term adverse effects [22]. However, high-dose methylprednisolone administered within 8 h of SCI has been reported to be effective [23]. A recent study showed that gonadal hormones can reduce the degeneration of motor neurons and muscle morphology after SCI [24], supporting the role of steroid hormones as neurotherapeutics for treatment of injuries to the nervous system. The recovery of neurological function after injury may be affected by changes in neurotransmitter transport in the spinal cord. Although glutamic acid is one of the most important excitatory amino acids in the CNS, playing crucial roles in neurogenesis and the induction of synaptic plasticity, glutamic acid can mediate neurotoxicity under pathological conditions, including trauma, degeneration and nervous system ischemia, by binding to its receptor and causing neurological dysfunction [25]. Immune system activity is significantly increased during the subacute stage after SCI, promoting a more complex inflammatory response. Cellular inflammation after SCI has complex, time-dependent functions. Macrophages/microglial cells peak 7 days after injury, further aggravating SCI [26]. However, infiltrating macrophages were shown to shift from proinflammatory to anti-inflammatory states over time [27,28]. In addition, blocking chemoattractant C5a-mediated inflammation 14 days after SCI reduced motor recovery and myelination of the damaged spinal cord, indicating that the late inflammatory response is associated with repair function [29].
KEGG analysis showed that pathways enriched 1 week after SCI included complement and coagulation cascades,
Analysis of the PPI network showed that C3, Ahsg, Kng1, Serpinc1, Apoa1, Alb, P4hb, Sec61a1, Tf, and Rpl15 were the top 10 core proteins altered 1 week after SCI and may be important in the pathological processes of SCI secondary injury. Inflammation is an important pathological reaction in secondary injury of SCI. It can activate the complement system, thus further enhancing inflammation and aggravating secondary injury after SCI [32]. C3 is an essential component of the complement cascade. Sensory axon regeneration after dorsal hemisection with peripheral conditioning lesions was shown to be significantly greater in the spinal cord of C3−/− mice than of wild-type C3+/+ mice [33]. C3 deficiency can reduce inflammation by inhibiting TNF-α expression and AST activation, thus attenuating secondary injury, improving neural regeneration, and promoting functional recovery after SCI [34]. Ahsg may be a risk factor for neurogenic heterotopic ossification (NHO) in patients with SCI [35]. Apolipoprotein plays an important physiological role in lipoprotein metabolism. Apoa1 is the main structural protein of high-density lipoprotein (HDL) and is abundant in cerebrospinal fluid [36]. Apoa1 may also improve tissue injury accompanied by uncontrolled inflammation and promote axonal repair by controlling inflammatory activity after CNS injury [36]. Indeed, Apoa1 was reported to promote neuronal healing after injury by activating the ERK pathway and actin polymerization [37]. Albumin has been shown to significantly improve motor and sensory recovery in rats, and albumin oleic acid therapy not only can help restore motor function but can also relieve symptoms after SCI, such as pain [38–41]. In addition, a recent study showed that serum albumin is an independent indicator of long-term neurological prognosis in SCI, suggesting that serum albumin may be prognostic of injury and stratification in clinical trials [42]. Iron (Fe), an essential element in all types of cells and organisms, is carried by Tf in interstitial fluids and plasma. A large amount of iron is released after SCI, resulting in increased formation of free radicals, which may aggravate tissue injury. As a carrier of iron, Tf may play a crucial role in the process [43].
Taken together with our previous findings, the present study further determined the key proteins and signal pathways that are involved 1 week after SCI, providing a more credible basis for understanding these pathological mechanisms. Although iTRAQ quantification is currently the most widely used technique in quantitative proteomics, it still has biological limitations. For example, the iTRAQ reagent can label almost all proteins and is easily contaminated by impurities in the sample and buffer. In addition, the sample currently studied was relatively small. Also, the data obtained from this rat model of SCI cannot be applied clinically, suggesting that similar studies be performed in non-human primates. Despite these limitations, the results presented here will enhance understanding of the molecular pathology of SCI after 1 week. Future studies should assess protein expression during other stages of SCI. Genomics, transcriptomics, and proteomics will also be combined to further explore and verify the pathways and molecular mechanisms 1 week after SCI.
Conclusions
In this study, iTRAQ-coupled LC-MS/MS proteomics analysis identified 295 DEPs in a rat model 1 week after SCI. A comprehensive bioinformatics analysis identified the key pathways that may be crucial mechanisms for the pathogenesis of SCI. Analysis indicated that C3, Ahsg, Kng1, Serpinc1, Apoa1, Alb, P4hb, Sec61a1, Tf, and Rpl15 may contribute to the pathogenesis 1 week after SCI.
Figures
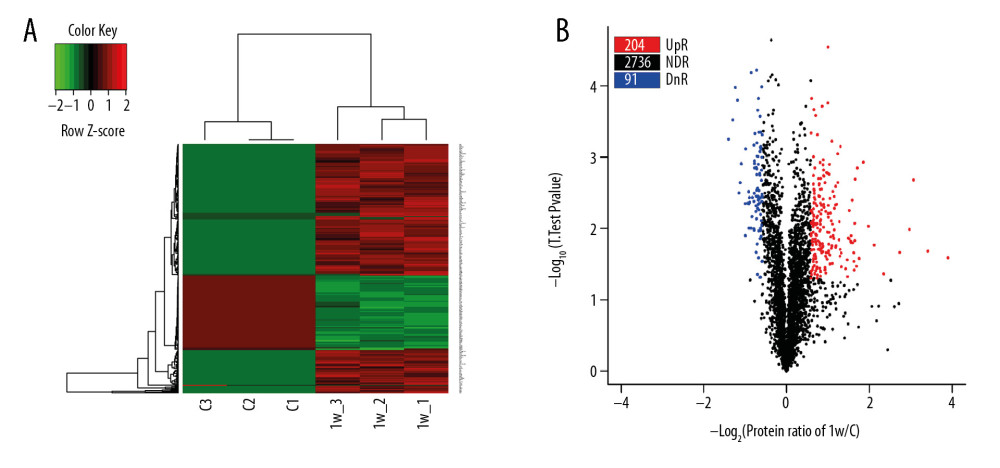 Figure 1. Heatmap and Volcano plot of the differentially expressed proteins (DEPs). (A) Heatmap of DEPs, in which red represents upregulated DEPs and green represents downregulated DEPs. (B) Volcano plot of DEPs. The X axis is the fold change (log 2), and the Y axis represents the P value (−log 10). Red points (fold change >1.5) indicate upregulated proteins, and blue points (fold change <−1.5) indicate downregulated proteins.
 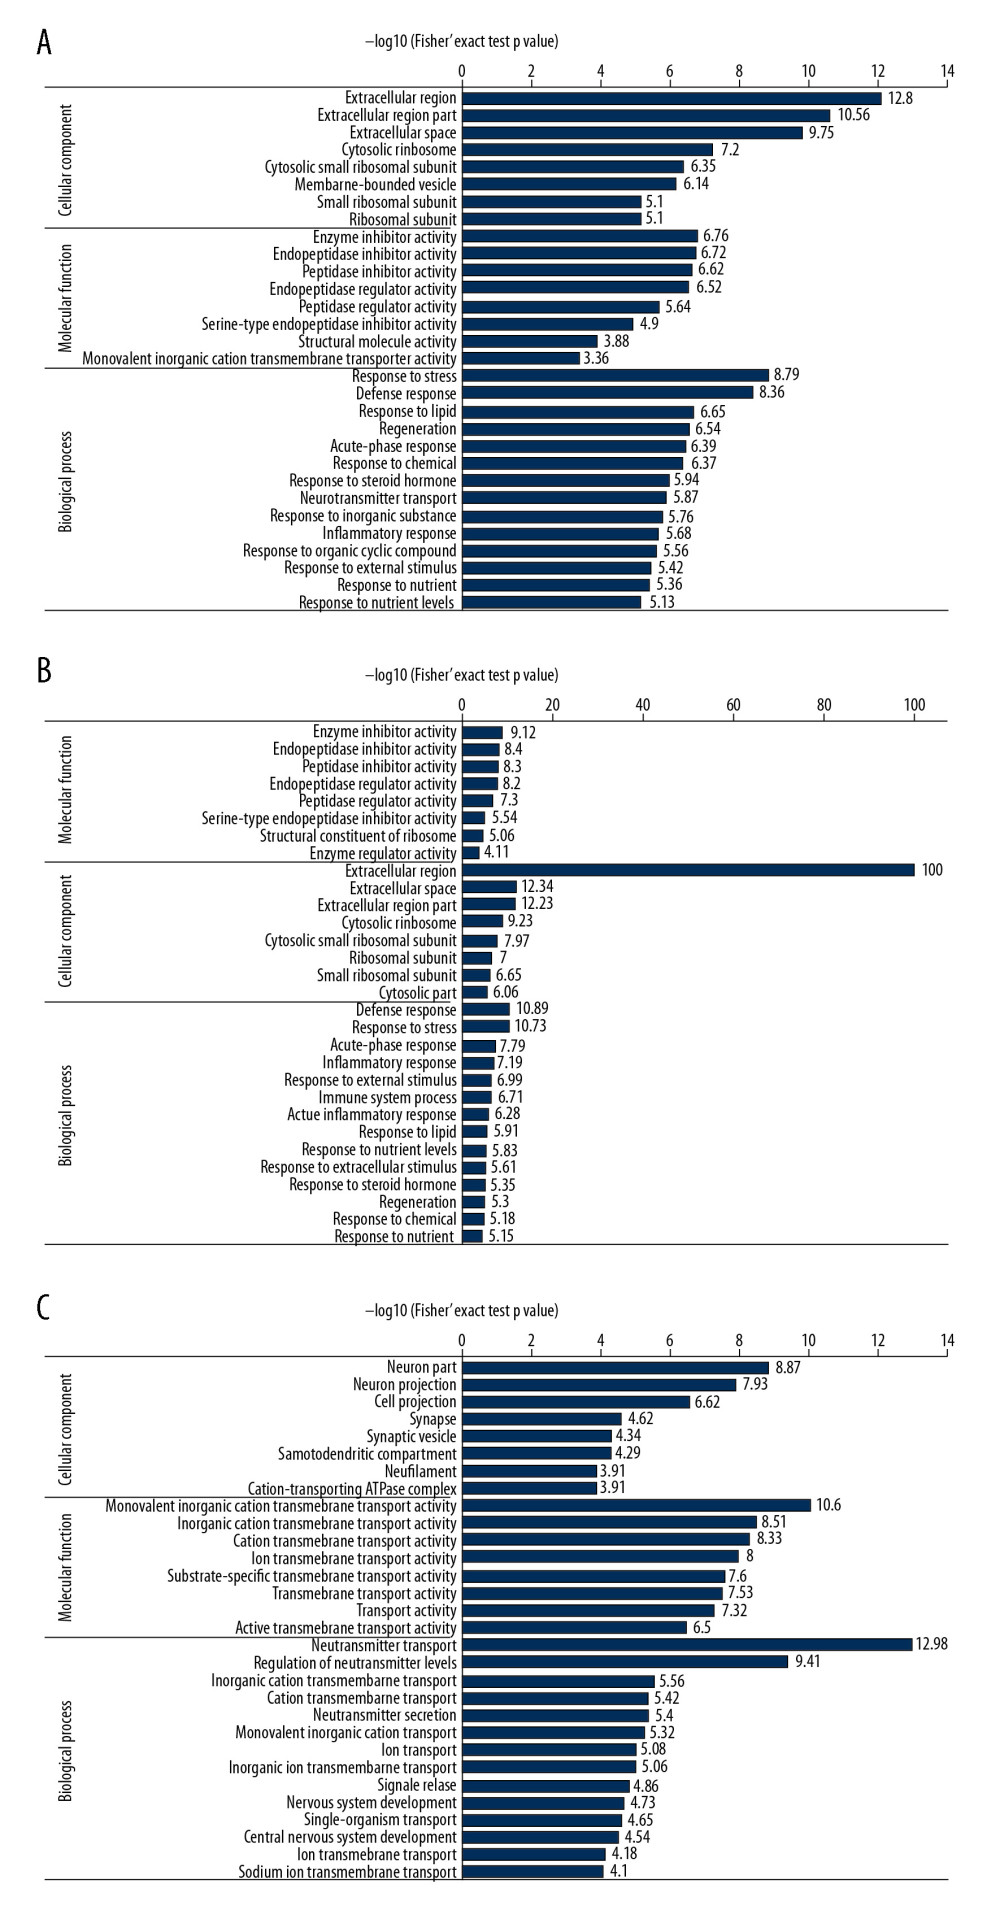 Figure 2. Gene Ontology (GO) term enrichment of differentially expressed proteins (DEPs). (A) All enriched GO terms of the DEPs in the 2 groups of rats. DEPs were categorized according to biological processes, cellular components and molecular functions. (B, C) Enriched terms upregulated (B) and downregulated (C) in the SCI compared with the control group.
 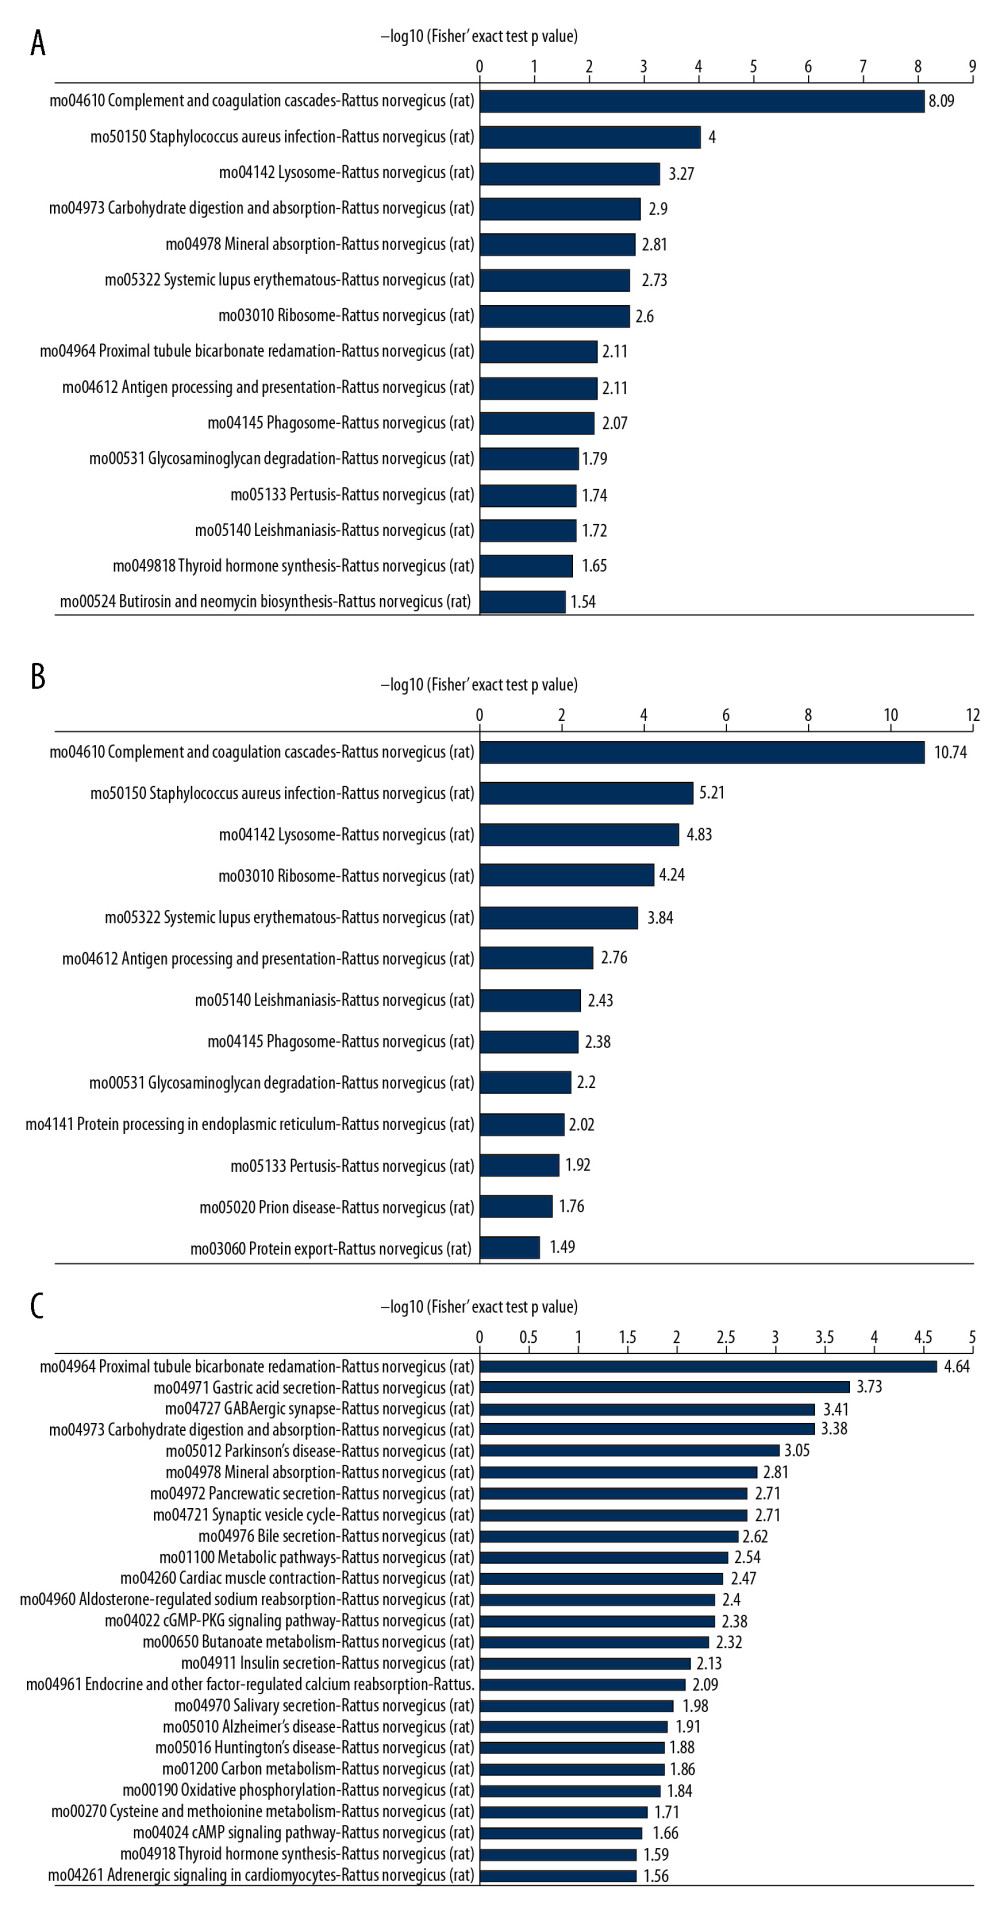 Figure 3. Kyoto Encyclopedia of Genes and Genomes (KEGG) pathway enrichment of the differentially expressed proteins (DEPs). (A) All enriched KEGG pathways of the DEPs in the 2 groups of rats. (B, C) Enriched pathways of DEPs upregulated (B) and downregulated (C) in the SCI compared with the control group.
 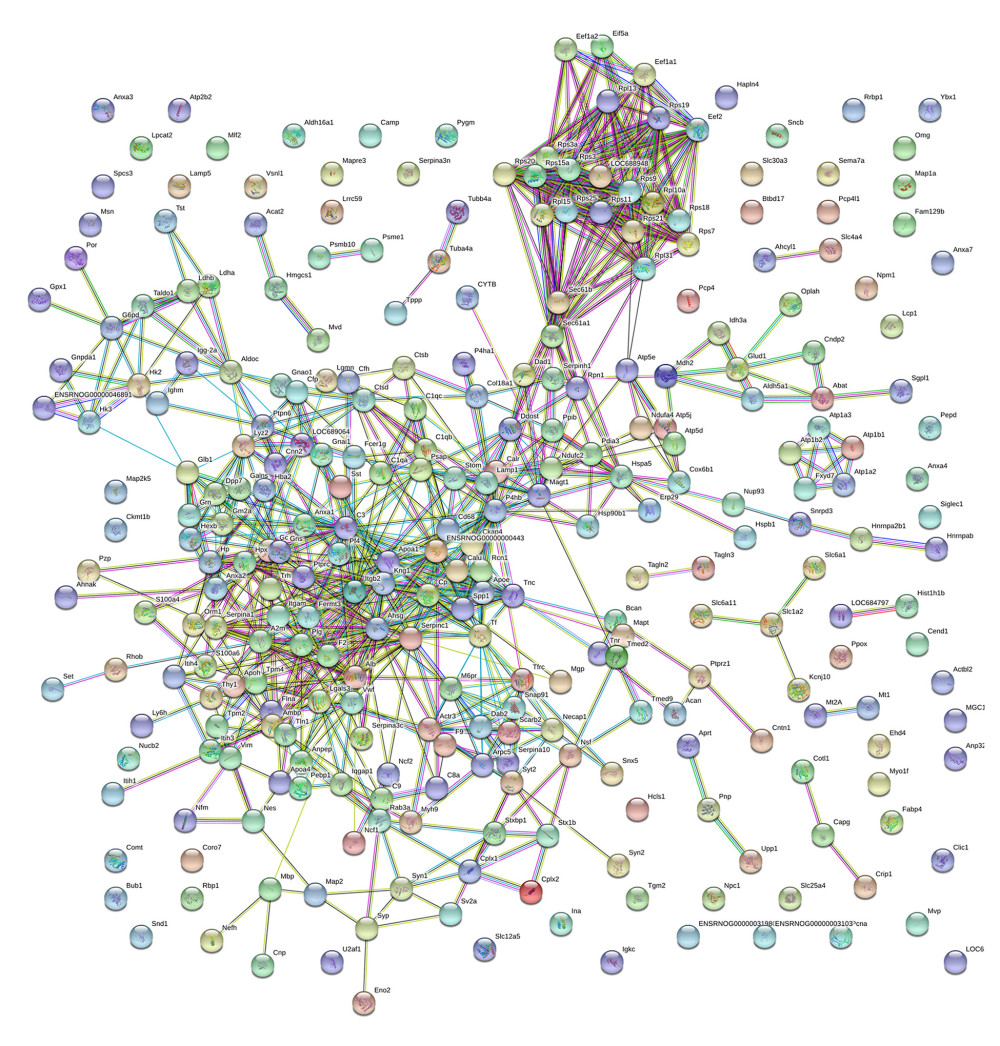 Figure 4. Protein–protein interaction (PPI) analysis of differentially expressed proteins (DEPs). Nodes indicate proteins, whereas lines indicate interactions between proteins.
 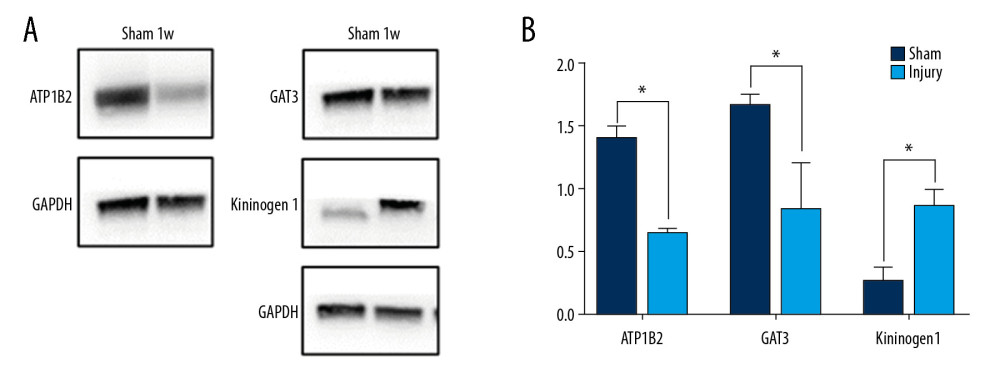 Figure 5. Western blotting of differentially expressed proteins (DEPs). (A) Expression of T-kininogen 1 (Kng1), sodium- and chloride-dependent GABA transporter 3 (Gat3) and sodium/potassium-transporting ATPase subunit beta (Atp1b2) in the SCI and control groups of rats. GAPDH levels were loading control. (B) Quantification of expression of DEPs. * P<0.05.
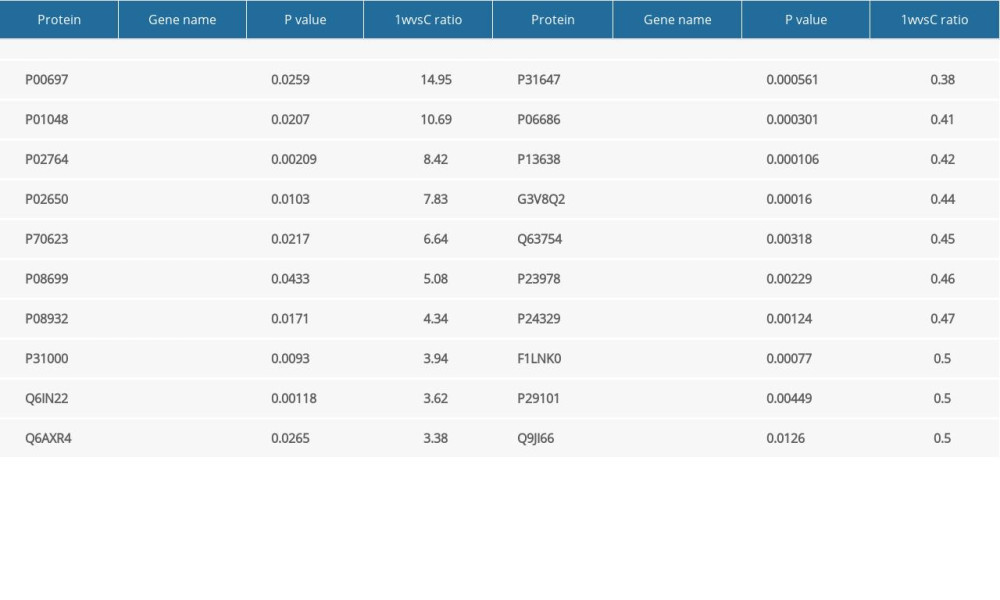
References
1. Kang Y, Ding H, Zhou HX, Epidemiology of worldwide spinal cord injury: A literature review: J Neurorestoratology, 2018; 6; 1-9
2. Jain NB, Ayers GD, Peterson EN, Traumatic spinal cord injury in the United States, 1993–2012: JAMA, 2015; 313(22); 2236-43
3. Ning GZ, Yu TQ, Feng SQ, Epidemiology of traumatic spinal cord injury in Tianjin, China: Spinal Cord, 2011; 49(3); 386-90
4. Tran AP, Warren PM, Silver J, The biology of regeneration failure and success after spinal cord injury: Physiol Rev, 2018; 98(2); 881-917
5. Ahuja CS, Wilson JR, Nori S, Traumatic spinal cord injury: Nat Rev Dis Primers, 2017; 3; 17018
6. Rowland JW, Hawryluk GWJ, Kwon B, Fehlings MG, Current status of acute spinal cord injury pathophysiology and emerging therapies: Promise on the horizon: Neurosurg Focus, 2008; 25(5); E2
7. Assinck P, Duncan GJ, Hilton BJ, Cell transplantation therapy for spinal cord injury: Nat Neurosci, 2017; 20(5); 637-47
8. Zhou H, Kang Y, Shi Z, Identification of differentially expressed proteins in rats with spinal cord injury during the transitional phase using an iTRAQ-based quantitative analysis: Gene, 2018; 677; 66-76
9. Huang H, Mao G, Chen L, Liu A, Progress and challenges with clinical cell therapy in neurorestoratology: J Neurorestoratology, 2015; 3; 91-95
10. Sarkis GA, Mangaonkar MD, Moghieb A, The application of proteomics to traumatic brain and spinal cord injuries: Curr Neurol Neurosci Rep, 2017; 17(3); 23
11. Wiese S, Reidegeld KA, Meyer HE, Warscheid B, Protein labeling by iTRAQ: A new tool for quantitative mass spectrometry in proteome research: Proteomics, 2007; 7(3); 340-50
12. Ban DX, Kong XH, Feng SQ, Intraspinal cord graft of autologous activated Schwann cells efficiently promotes axonal regeneration and functional recovery after rat’s spinal cord injury: Brain Res, 2009; 1256; 149-61
13. Franceschini A, Szklarczyk D, Frankild S, STRING v9.1: Protein–protein interaction networks, with increased coverage and integration: Nucleic Acids Res, 2013; 41(Database issue); D808-15
14. Smoot ME, Ono K, Ruscheinski J, Cytoscape 2.8: New features for data integration and network visualization: Bioinformatics, 2011; 27(3); 431-32
15. Singh A, Tetreault L, Kalsi-Ryan S, Global prevalence and incidence of traumatic spinal cord injury: Clin Epidemiol, 2014; 6; 309-31
16. Ning GZ, Wu Q, Li YL, Feng SQ, Epidemiology of traumatic spinal cord injury in Asia: A systematic review: J Spinal Cord Med, 2012; 35(4); 229-39
17. Liu JM, Zhao K, Du LX, AMD3100 inhibits the migration and differentiation of neural stem cells after spinal cord injury: Sci Rep, 2017; 7(1); 64
18. Noristani HN, Perrin FE, Astrocyte-to-neuron conversion induced by spinal cord injury: Oncotarget, 2016; 7(51); 83831-32
19. Chen XG, Hua F, Wang SG, Phosphodiesterase inhibitor ameliorates neuronal injury in spinal cord ischemia/reperfusion injured rat model: Biomed Pharmacother, 2017; 93; 1213-19
20. Duan HQ, Wu QL, Yao X, Nafamostat mesilate attenuates inflammation and apoptosis and promotes locomotor recovery after spinal cord injury: CNS Neurosci Ther, 2018; 24(5); 429-38
21. Lemmens S, Nelissen S, Dooley D, Stress pathway modulation is detrimental or ineffective for functional recovery after spinal cord injury in mice: J Neurotrauma, 2020; 37(3); 564-71
22. Bydon M, Lin J, Macki M, The current role of steroids in acute spinal cord injury: World Neurosurg, 2014; 82(5); 848-54
23. Bracken MB, Steroids for acute spinal cord injury: Cochrane Database Syst Rev, 2012; 1(1); CD001046
24. Sengelaub DR, Xu XM, Protective effects of gonadal hormones on spinal motoneurons following spinal cord injury: Neural Regen Res, 2018; 13(6); 971-76
25. Liu D, Xu GY, Pan E, McAdoo DJ, Neurotoxicity of glutamate at the concentration released upon spinal cord injury: Neuroscience, 1999; 93(4); 1383-89
26. Popovich PG, Guan Z, Wei P, Depletion of hematogenous macrophages promotes partial hindlimb recovery and neuroanatomical repair after experimental spinal cord injury: Exp Neurol, 1999; 158(2); 351-65
27. Arnold L, Henry A, Poron F, Inflammatory monocytes recruited after skeletal muscle injury switch into antiinflammatory macrophages to support myogenesis: J Exp Med, 2007; 204(5); 1057-69
28. Villalta SA, Nguyen HX, Deng B, Shifts in macrophage phenotypes and macrophage competition for arginine metabolism affect the severity of muscle pathology in muscular dystrophy: Hum Mol Genet, 2009; 18(3); 482-96
29. Beck KD, Nguyen HX, Galvan MD, Quantitative analysis of cellular inflammation after traumatic spinal cord injury: Evidence for a multiphasic inflammatory response in the acute to chronic environment: Brain, 2010; 133(Pt 2); 433-47
30. Anderson AJ, Robert S, Huang W, Activation of complement pathways after contusion-induced spinal cord injury: J Neurotrauma, 2004; 21(12); 1831-46
31. Reynolds DN, Smith SA, Zhang YP, Vaccinia virus complement control protein reduces inflammation and improves spinal cord integrity following spinal cord injury: Ann NY Acad Sci, 2004; 1035; 165-78
32. Peterson SL, Anderson AJ, Complement and spinal cord injury: Traditional and non-traditional aspects of complement cascade function in the injured spinal cord microenvironment: Exp Neurol, 2014; 258; 35-47
33. Peterson SL, Nguyen HX, Mendez OA, Anderson AJ, Complement protein C3 suppresses axon growth and promotes neuron loss: Sci Rep, 2017; 7(1); 12904
34. Guo Q, Li S, Liang Y, Effects of C3 deficiency on inflammation and regeneration following spinal cord injury in mice: Neurosci Lett, 2010; 485(1); 32-36
35. Dong L, Dong G, Cao J, Zhang J, Association of α2-HS glycoprotein with neurogenic heterotopic ossification in patients with spinal cord injury: Med Sci Monit, 2017; 23; 5382-88
36. Sengupta MB, Mukhopadhyay D, Possible role of apolipoprotein A1 in healing and cell death after neuronal injury: Front Biosci (Elite Ed), 2016; 8; 460-77
37. Sengupta MB, Saha S, Mohanty PK, Increased expression of ApoA1 after neuronal injury may be beneficial for healing: Mol Cell Biochem, 2017; 424(1–2); 45-55
38. Bento-Abreu A, Velasco A, Polo-Hernandez E, Megalin is a receptor for albumin in astrocytes and is required for the synthesis of the neurotrophic factor oleic acid: J Neurochem, 2008; 106(3); 1149-59
39. Tabernero A, Velasco A, Granda B, Transcytosis of albumin in astrocytes activates the sterol regulatory element-binding protein-1, which promotes the synthesis of the neurotrophic factor oleic acid: J Biol Chem, 2002; 277(6); 4240-46
40. Prajapati KD, Sharma SS, Roy N, Current perspectives on potential role of albumin in neuroprotection: Rev Neurosci, 2011; 22(3); 355-63
41. Avila-Martin G, Galan-Arriero I, Gomez-Soriano J, Taylor J, Treatment of rat spinal cord injury with the neurotrophic factor albumin-oleic acid: Translational application for paralysis, spasticity and pain: PLoS One, 2011; 6(10); e26107
42. Tong B, Jutzeler CR, Cragg JJ, Serum albumin predicts long-term neurological outcomes after acute spinal cord injury: Neurorehabil Neural Repair, 2018; 32(1); 7-17
43. Koszyca B, Manavis J, Cornish RJ, Blumbergs PC, Patterns of immunocytochemical staining for ferritin and transferrin in the human spinal cord following traumatic injury: J Clin Neurosci, 2002; 9(3); 298-301
Figures
Figure 1. Heatmap and Volcano plot of the differentially expressed proteins (DEPs). (A) Heatmap of DEPs, in which red represents upregulated DEPs and green represents downregulated DEPs. (B) Volcano plot of DEPs. The X axis is the fold change (log 2), and the Y axis represents the P value (−log 10). Red points (fold change >1.5) indicate upregulated proteins, and blue points (fold change <−1.5) indicate downregulated proteins.Figure 2. Gene Ontology (GO) term enrichment of differentially expressed proteins (DEPs). (A) All enriched GO terms of the DEPs in the 2 groups of rats. DEPs were categorized according to biological processes, cellular components and molecular functions. (B, C) Enriched terms upregulated (B) and downregulated (C) in the SCI compared with the control group.Figure 3. Kyoto Encyclopedia of Genes and Genomes (KEGG) pathway enrichment of the differentially expressed proteins (DEPs). (A) All enriched KEGG pathways of the DEPs in the 2 groups of rats. (B, C) Enriched pathways of DEPs upregulated (B) and downregulated (C) in the SCI compared with the control group.Figure 4. Protein–protein interaction (PPI) analysis of differentially expressed proteins (DEPs). Nodes indicate proteins, whereas lines indicate interactions between proteins.Figure 5. Western blotting of differentially expressed proteins (DEPs). (A) Expression of T-kininogen 1 (Kng1), sodium- and chloride-dependent GABA transporter 3 (Gat3) and sodium/potassium-transporting ATPase subunit beta (Atp1b2) in the SCI and control groups of rats. GAPDH levels were loading control. (B) Quantification of expression of DEPs. * P<0.05. In Press
Clinical Research
Body Weight and Insulin Resistance Indicators Among ChildrenMed Sci Monit In Press; DOI: 10.12659/MSM.951434
Clinical Research
Comparison of Radiographic Cervical Sagittal Alignment Parameters in Patients With Nonspecific Neck Pain, D...Med Sci Monit In Press; DOI: 10.12659/MSM.952950
Clinical Research
Combined Fibrinogen and Urinary α1-Microglobulin as Predictors of Respiratory Tract Infection in Children w...Med Sci Monit In Press; DOI: 10.12659/MSM.951066
Database Analysis
Evaluation of Salivary Total Oxidant Status (TOS) and Total Antioxidant Status (TAS) in Orthodontic Patient...Med Sci Monit In Press; DOI: 10.12659/MSM.952052
Most Viewed Current Articles
17 Jan 2024 : Review article 14,175,576
Vaccination Guidelines for Pregnant Women: Addressing COVID-19 and the Omicron VariantDOI :10.12659/MSM.942799
Med Sci Monit 2024; 30:e942799
13 Nov 2021 : Clinical Research 3,756,620
Acceptance of COVID-19 Vaccination and Its Associated Factors Among Cancer Patients Attending the Oncology ...DOI :10.12659/MSM.932788
Med Sci Monit 2021; 27:e932788
14 Dec 2022 : Clinical Research 2,465,966
Prevalence and Variability of Allergen-Specific Immunoglobulin E in Patients with Elevated Tryptase LevelsDOI :10.12659/MSM.937990
Med Sci Monit 2022; 28:e937990
16 May 2023 : Clinical Research 708,651
Electrophysiological Testing for an Auditory Processing Disorder and Reading Performance in 54 School Stude...DOI :10.12659/MSM.940387
Med Sci Monit 2023; 29:e940387