02 August 2020 : Database Analysis
Prognostic Implications of Novel Gene Signatures in Gastric Cancer Microenvironment
Mengyu Sun1ACE, Jieping Qiu1BCF, Huazheng Zhai1BDF, Yaoqun Wang1DF, Panpan Ma1EF, Mengyin Li1E, Bo Chen2AG*DOI: 10.12659/MSM.924604
Med Sci Monit 2020; 26:e924604


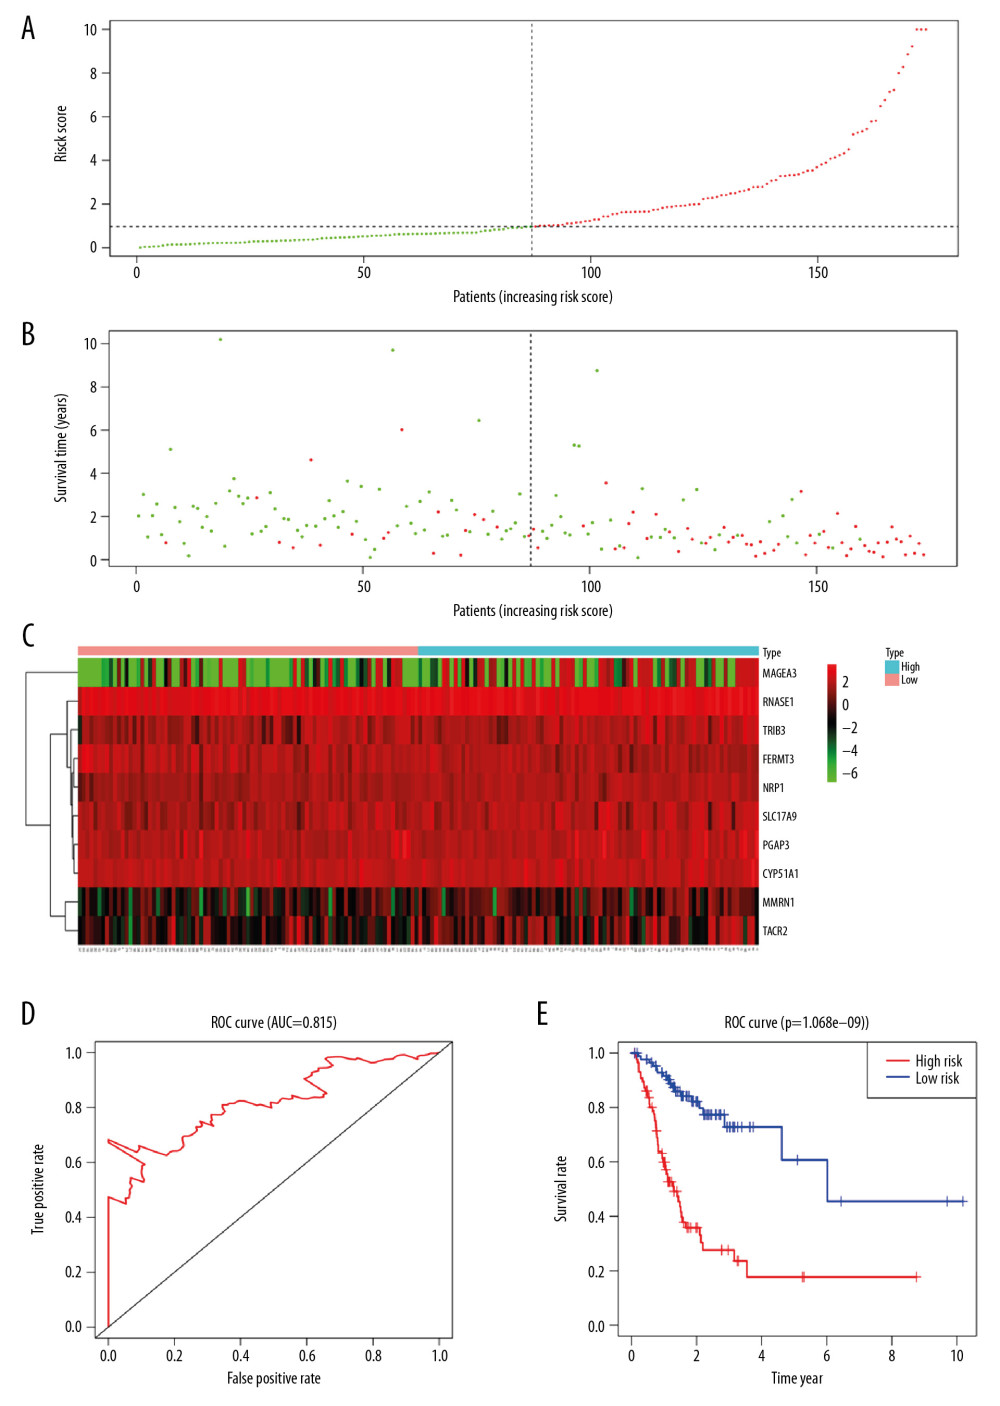
Figure 5 Characteristics of the risk assessment model in training group. (A, B) The distribution of risk score, patients’ survival and status for STAD. The black dotted line divided patients into high-risk group and low-risk group. (C) Heatmap of gene expression profiles in risk assessment model for STAD. (D) The ROC curve was applied to assess the predictive performance of the risk assessment model. (E) Kaplan-Meier survival analysis of STAD patients stratified by the median risk score. STAD – stomach adenocarcinoma; ROC – receiver operating characteristic.