01 October 2020 : Database Analysis
COL3A1, COL6A3, and SERPINH1 Are Related to Glucocorticoid-Induced Osteoporosis Occurrence According to Integrated Bioinformatics Analysis
Liuxun Li1ABCDEF, Meiling Yang2BCDEF, Anmin Jin1ABCDEFG*DOI: 10.12659/MSM.925474
Med Sci Monit 2020; 26:e925474


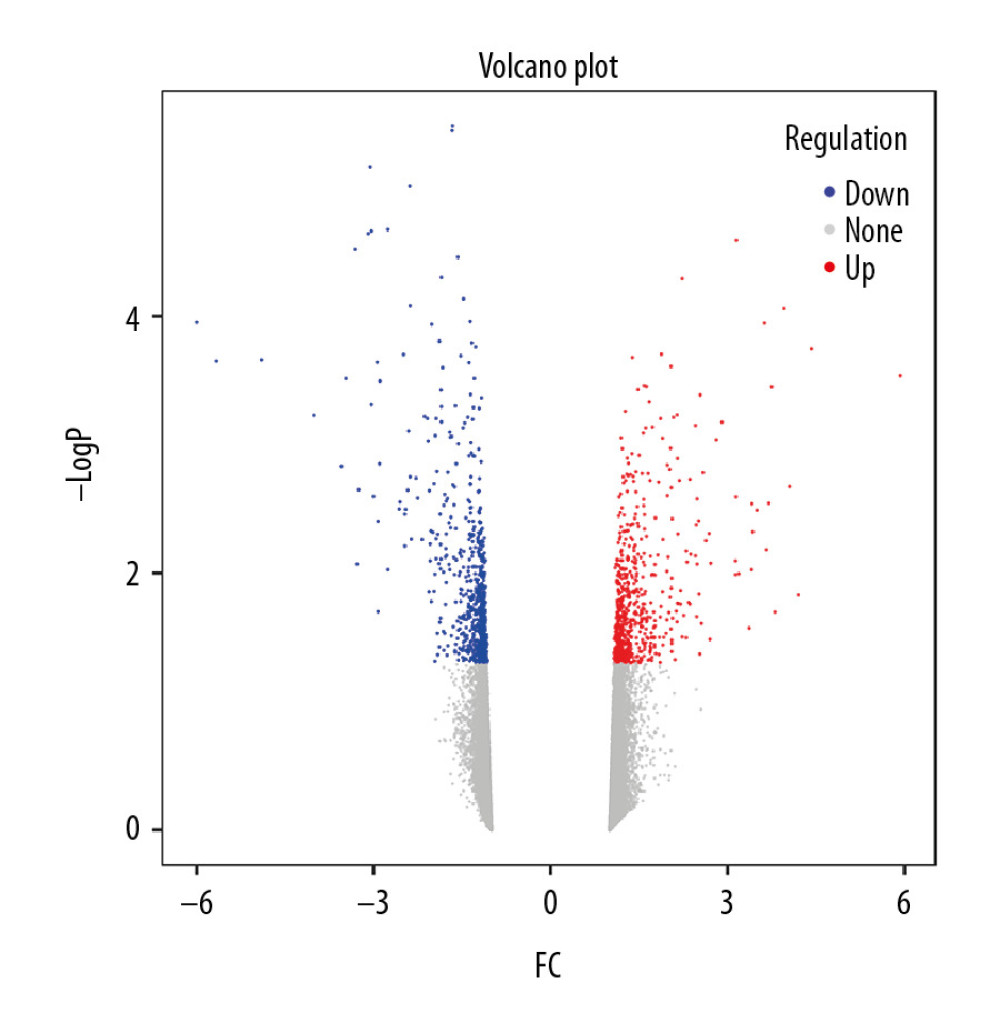
Figure 2 Volcano plot of DEGs. The red nodes represent upregulated genes selected upon the |log2FC| ≥1.0 and P<0.05 thresholds, while the blue nodes stand for downregulated genes selected upon the |log2FC| ≥1.0 and P<0.05 thresholds, and the gray nodes indicate the nonsignificant genes. DEGs – differentially expressed genes; FC – fold change.